

🧭 I. Background
During the long-term performance optimization of the WordPress site, I gradually introduced the following technical components:
- W3 Total Cache
- Redis Object Cache
- Nginx + OneinStack
- Cloudflare CDN
The goal of this evaluation:
Build a quantifiable, comparable, and reusable performance evaluation system for WordPress global acceleration.
📚 II. Relevant Historical Baseline Data
📌 1. Baseline Before CDN Deployment
👉 WordPress Theme Performance Comparison: Hueman vs Twenty Twenty-Five (Pre-CDN Baseline)
Provides:
- WebPageTest data before CDN deployment
- boce baseline data
- Original Request Table structure
📌 2. W3TC Cache Misjudgment Correction
👉 Full Troubleshooting Process for WordPress + Nginx + W3 Total Cache Not Taking Effect
Used to explain:
❗ The early conclusion that “Page Cache is not working” was incorrect. The root cause was a misjudgment of the cache state, not a lack of system support.
🧪 III. Anomalies After CDN Deployment
Anomalies appeared during initial testing after the CDN went live:
- boce average response time increased
- WebPageTest TTFB rose
- Some nodes were inaccessible
- Overall performance degraded
📸 Figure 1: First boce Test After CDN Deployment

📸 Figure 2: WebPageTest Results After CDN Deployment

📸 Figure 3: boce Second Round Test Results

🧠 IV. Key Turning Point: Trigger for Cache Misjudgment
While analyzing “why the CDN made things slower,” I discovered a key anomaly:
❗ The magnitude of the performance degradation far exceeded the reasonable range of latency added by simply introducing an extra network layer via the CDN.
🔍 After Reviewing Changes, I Found:
- CDN configuration was normal
- Nginx was running normally
- Redis was normal
- WordPress had not been updated
👉 The only change:
❗ W3 Total Cache Page Cache was disabled
🧪 Re-verification Experiment
After re-enabling Page Cache:
- CDN remained unchanged
- Ran boce + WebPageTest tests again
📊 V. WebPageTest

| Metric | Value |
|---|---|
| TTFB | 0.175s |
| FCP | 0.907s |
| LCP | 1.217s |
| Speed Index | 1.787 |
| CLS | 0.042 |
| TBT | 0.073s |
| Requests | 78 |
| Fully Loaded | 5.795s |
| Page Size | 2MB |
📊 VI. Comparison Before vs. After CDN Deployment
🌐 boce Comparison
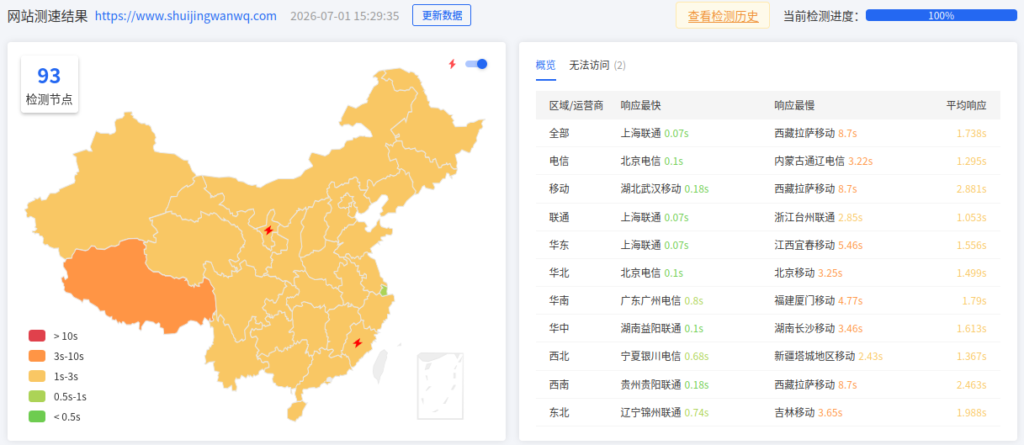
| Item | Before CDN | After CDN |
|---|---|---|
| Average response | 4–5s | 1–2s |
| Slowest node | 10s | 8–10s |
| Inaccessible | A few | Very few |
| Stability | Medium | Significantly improved |
🌐 WebPageTest Comparison
| Metric | Before CDN | After CDN |
|---|---|---|
| TTFB | 0.668s | 0.175s |
| FCP | 2.053s | 0.907s |
| LCP | 2.261s | 1.217s |
| Speed Index | 2.353 | 1.787 |
| Requests | 76 | 78 |
🧠 VII. Request Table Structure Change Analysis

✔ Before CDN Deployment
- CSS/JS load paths were concentrated
- Obvious origin fetches for image assets
- Long blocking chains
- Slow time to first byte
✔ After CDN Deployment
- Improved CDN hit rate for static assets
- Significant drop in time to first byte
- Optimized resource chains
- Reduced origin requests
🧠 VIII. WordPress CDN Performance Scoring System
🧮 1. boce Scoring Model (Stability)
| Metric | Weight |
|---|---|
| Average response time | 40% |
| Slowest node | 20% |
| Inaccessible | 30% |
| Volatility | 10% |
🧮 boce Scoring Results
| State | Score |
|---|---|
| Before CDN | 70 |
| After CDN | 90 |
⚡ 2. WebPageTest Scoring Model (Performance)
| Metric | Weight |
|---|---|
| TTFB | 30% |
| FCP | 20% |
| LCP | 20% |
| Speed Index | 20% |
| TBT | 10% |
⚡ WebPageTest Scoring Results
| State | Score |
|---|---|
| Before CDN | 72 |
| After CDN | 92 |
🧱 3. Request Table Scoring Model (Structure)
| Item | Score |
|---|---|
| CDN hit rate | Improved |
| JS blocking | Reduced |
| CSS structure | Optimized |
| Image loading | More distributed |
🧱 Structure Score
| State | Score |
|---|---|
| Before CDN | 68 |
| After CDN | 88 |
📊 IX. Comprehensive Scoring Model (Core Conclusion)
🧮 WordPress CDN Comprehensive Score
| Dimension | Weight | Before CDN | After CDN |
|---|---|---|---|
| boce stability | 35% | 70 | 90 |
| WebPageTest performance | 40% | 72 | 92 |
| Request structure | 25% | 68 | 88 |
🎯 Final Scoring Results
| State | Total Score |
|---|---|
| Before CDN | 70/100 |
| After CDN | 90/100 |
🧠 X. Key Findings
🎯 1. Clear Real-World CDN Benefits
- Significant drop in TTFB
- Clear optimization of FCP/LCP
- Improved global access stability
🎯 2. W3TC Page Cache Is the Key Variable
Root cause of the performance degradation:
❗ It was not the CDN, but rather that Page Cache had been disabled.
🎯 3. The Performance Issue Is Fundamentally a Cache Loop Issue
CDN + Page Cache + Object Cache
All three are indispensable.
🧠 XI. Key Cognitive Correction (Very Important)
❌ Old Understanding
- Page Cache does not work under Nginx
- CDN degradation = CDN problem
- Whether caching is configured determines performance
✅ New Understanding
- Page Cache actually works natively
- CDN issues are often cache state issues
- The key to performance is “whether cache hits occur”
🧭 XII. Final Architecture (After Verification)
User
 ↓
Cloudflare CDN
 ↓
Nginx
 ↓
W3 Total Cache Page Cache
 ↓
PHP-FPM
 ↓
WordPress
 ↓
Redis Object Cache
🎯 XIII. One-Sentence Summary
The essence of WordPress performance optimization is not simply adding a CDN or caching, but ensuring the caching system forms a complete loop and actually scores cache hits.