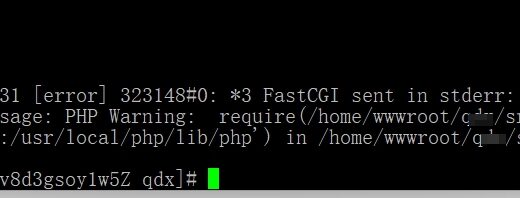
My personal blog, today suddenly responded to 504’s troubleshooting process
1. My personal blog suddenly responded to 504’s investigation and resolution process today. as shown in Figure 1
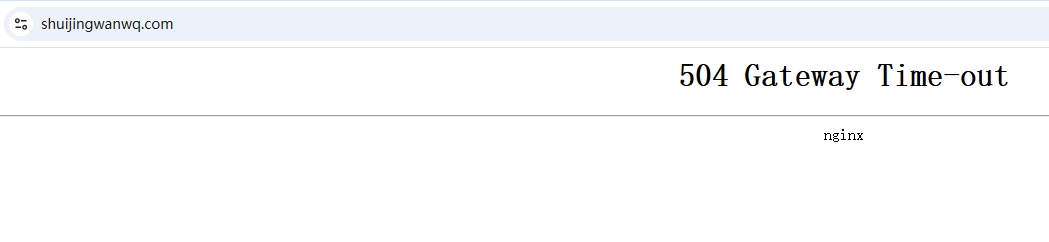
2. 504 Gateway Timeout Description Nginx (or other reverse proxy) waits for the backend (PHP-FPM) response timeout. Check in the following order:
3. Execute the top command, the result is shown as follows: The problem is very clear, and the server is seriously overloaded. Key data: load 19.77 (normally it should be below 1-2), 21 processes are running (too much), the CPU usage is 87.4%, and the memory is 1968MB and only 96MB is available. This is a small machine with 2G memory and has been crushed. as shown in Figure 2
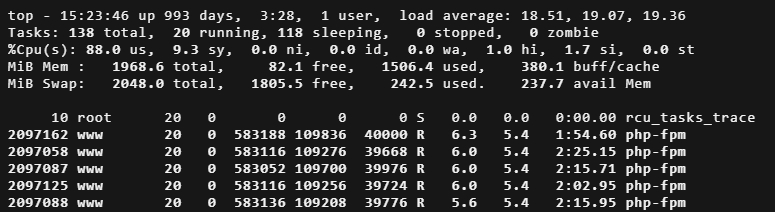
top - 15:21:01 up 993 days,  3:25,  1 user,  load average: 18.68, 19.55, 19.55
Tasks: 139 total,  20 running, 119 sleeping,   0 stopped,   0 zombie
%Cpu(s): 88.0 us,  9.0 sy,  0.0 ni,  0.0 id,  0.0 wa,  1.3 hi,  1.7 si,  0.0 st
MiB Mem :   1968.6 total,     76.8 free,   1481.2 used,    410.6 buff/cache
MiB Swap:   2048.0 total,   1816.6 free,    231.4 used.    262.7 avail Mem
3. Exit the top and execute: ps aux –sort=-%cpu | head -20, see what process is eating resources. The reason was found. 15+ PHP-FPM subprocesses run at the same time, each occupying 110MB of memory, and php-fpm alone has eaten nearly 1.6GB, and the server has only 2GB of memory in total, which is directly bursting.
[root@iZ23wv7v5ggZ ~]# ps aux --sort=-%cpu | head -20
USER         PID %CPU %MEM    VSZ   RSS TTY      STAT START   TIME COMMAND
www      2097069  5.6  5.4 583184 109280 ?       S    14:41   2:29 php-fpm: pool www
www      2097086  5.6  5.3 583376 108720 ?       R    14:43   2:23 php-fpm: pool www
www      2097087  5.6  5.5 585100 111712 ?       R    14:43   2:22 php-fpm: pool www
www      2097088  5.6  5.4 583136 109108 ?       S    14:43   2:22 php-fpm: pool www
www      2097093  5.6  5.4 583132 109292 ?       R    14:44   2:18 php-fpm: pool www
www      2097094  5.6  5.4 583132 109344 ?       R    14:44   2:18 php-fpm: pool www
www      2097109  5.6  5.4 583372 109752 ?       R    14:45   2:16 php-fpm: pool www
www      2097125  5.6  5.4 583116 109200 ?       R    14:47   2:09 php-fpm: pool www
www      2097162  5.6  5.4 583324 109732 ?       R    14:49   2:01 php-fpm: pool www
www      2097187  5.6  5.4 583244 109848 ?       R    14:53   1:48 php-fpm: pool www
www      2097281  5.6  5.4 583124 109308 ?       R    15:03   1:17 php-fpm: pool www
www      2097299  5.6  5.4 583052 109328 ?       R    15:05   1:09 php-fpm: pool www
www      2097341  5.6  5.4 583116 109408 ?       S    15:10   0:52 php-fpm: pool www
www      2097671  5.6  5.5 583052 112304 ?       R    15:18   0:24 php-fpm: pool www
www      2097746  5.5  5.5 582836 111876 ?       S    15:24   0:02 php-fpm: pool www
www      2097747  5.4  5.5 582852 111988 ?       R    15:25   0:01 php-fpm: pool www
root     1007745  3.2  1.0 154220 20344 ?        Ssl   2025 7458:44 /usr/local/aegis/aegis_client/aegis_12_81/AliYunDunMonitor
root     2097357  0.5  7.7 516416 156836 ?       RNs  15:11   0:04 /usr/libexec/platform-python /usr/bin/dnf makecache --timer
root     1007719  0.3  0.3  99308  6048 ?        Ssl   2025 756:25 /usr/local/aegis/aegis_client/aegis_12_81/AliYunDun
[root@iZ23wv7v5ggZ ~]#
4. Emergency recovery first, then check the root cause. First look at how many php-fpm processes there are in total. A total of 17.
[root@iZ23wv7v5ggZ ~]# ps aux | grep php-fpm | grep -v grep | wc -l
17
5. Edit the php-fpm configuration, the server only has 2GB memory, modify it to run 5 subprocesses, edit the file /usr/local/php/etc/php-fpm.conf. as shown in Figure 3

Before modification:
pm = dynamic
pm.max_children = 16
pm.start_servers = 10
pm.min_spare_servers = 8
pm.max_spare_servers = 16
pm.max_requests = 2048
After modification:
pm = dynamic
pm.max_children = 5
pm.start_servers = 2
pm.min_spare_servers = 1
pm.max_spare_servers = 3
pm.max_requests = 500
6. Restart after saving: execute the command: as shown in Figure 4
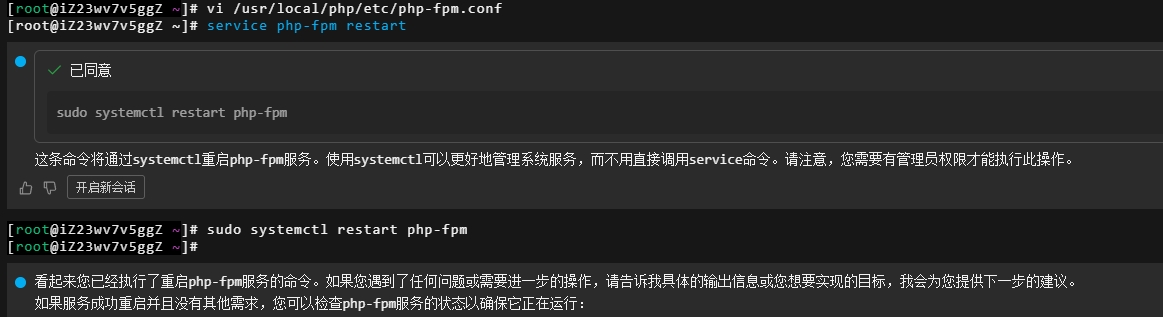
[root@iZ23wv7v5ggZ ~]# service php-fpm restart
[root@iZ23wv7v5ggZ ~]# sudo systemctl restart php-fpm
7. Execute the top command, the result is displayed as follows. The memory has been restored, from 96MB idle to 1214MB, and the PHP-FPM adjustment has taken effect. The load is also decreasing (19.77 → 7.97). But the CPU is still 85.4%, and there are still 8 processes running, which is not normal.
top - 15:55:11 up 993 days,  3:59,  1 user,  load average: 7.97, 11.01, 15.32
Tasks: 124 total,   8 running, 116 sleeping,   0 stopped,   0 zombie
%Cpu(s): 85.4 us,  9.9 sy,  0.0 ni,  1.0 id,  0.0 wa,  1.0 hi,  2.6 si,  0.0 st
MiB Mem :   1968.6 total,   1214.1 free,    302.7 used,    451.8 buff/cache
MiB Swap:   2048.0 total,   1878.8 free,    169.2 used.   1469.1 avail Mem
8. Let’s see what is eating the CPU: Execute the command: ps aux –sort=-%cpu | head -10 , all 5 php-fpm processes are full, indicating that there are a lot of continuous requests to hit my server.
[root@iZ23wv7v5ggZ ~]# ps aux --sort=-%cpu | head -10
USER         PID %CPU %MEM    VSZ   RSS TTY      STAT START   TIME COMMAND
www      2098124 17.0  3.1 452724 63280 ?        R    15:57   0:06 php-fpm: pool www
www      2098123 16.8  2.9 452404 59716 ?        R    15:57   0:06 php-fpm: pool www
www      2098122 16.7  3.0 452868 61800 ?        R    15:57   0:06 php-fpm: pool www
www      2098125 16.7  2.9 452404 59712 ?        R    15:57   0:06 php-fpm: pool www
www      2098126 16.6  3.0 452732 60772 ?        R    15:57   0:06 php-fpm: pool www
root     1007745  3.2  1.0 154220 20160 ?        Ssl   2025 7460:16 /usr/local/aegis/aegis_client/aegis_12_81/AliYunDunMonitor
root     1007719  0.3  0.2  99308  5772 ?        Ssl   2025 756:31 /usr/local/aegis/aegis_client/aegis_12_81/AliYunDun
www      2040873  0.2  1.4 186640 29872 ?        R    Feb17  24:56 nginx: worker process
root         754  0.1  0.2 555732  4480 ?        Ssl   2023 2189:58 /usr/libexec/platform-python -Es /usr/sbin/tuned -l -P
[root@iZ23wv7v5ggZ ~]#
9. Check the access log of the virtual host of my blog, the single IP of the blog has little traffic, but the IP The segment is very concentrated (222.167.251.x, 143.20.219.x, 66.92.14.x), which looks like a distributed crawler. But each IP has only 2 requests, and it is unlikely that they will blow up the server.
[root@iZ23wv7v5ggZ ~]# tail -200 /data/wwwlogs/www.shuijingwanwq.com_nginx.log | awk '{print $1}' | sort | uniq -c | sort -rn | head -20
2 66.92.14.197
2 222.167.251.94
2 222.167.251.83
2 222.167.251.69
2 222.167.251.248
2 222.167.251.161
2 222.167.251.155
2 222.167.251.100
2 143.20.219.38
2 143.20.219.227
2 143.20.219.208
2 143.20.219.199
2 136.0.94.36
2 13.53.45.144
1 66.92.14.92
1 66.92.14.90
1 66.92.14.85
1 66.92.14.8
1 66.92.14.77
1 66.92.14.75
10. It may be caused by the traffic of other virtual hosts. Check it out: to see which log file is most frequently written recently. The main traffic is concentrated on my blog (21MB log) and access_nginx.log (7MB).
<h1>看哪个日志文件最近写入最频繁</h1>
ls -lt /data/wwwlogs/*.log | head -10

-rw-r--r-- 1 www root 21765969 Feb 25 16:01 /data/wwwlogs/www.shuijingwanwq.com_nginx.log
-rw-r--r-- 1 www root  7330312 Feb 25 16:01 /data/wwwlogs/access_nginx.log
-rw-r--r-- 1 www root     2189 Feb 25 15:47 /data/wwwlogs/error_nginx.log
-rw-r--r-- 1 www root    48532 Feb 25 15:40 /data/wwwlogs/learn-php-app-0605-prod.wangqiang.store_nginx.log
-rw-r--r-- 1 www root   213953 Feb 25 11:03 /data/wwwlogs/tym-jammerall.shuijingwanwq.com_nginx.log
-rw-r--r-- 1 www root        0 Jun 16  2023 /data/wwwlogs/learn-php-app-0605-prod.shuijingwanwq.com_nginx.log
-rw-r--r-- 1 www root        0 Jun  8  2023 /data/wwwlogs/fanxiapp-wangqiang-larabbs.shuijingwanwq.com_nginx.log
11. Look at the traffic source of access_nginx.log and found it! 183.129.189.60 This IP accounts for 177 of the 200 logs. Block this IP first:
[root@iZ23wv7v5ggZ ~]# tail -200 /data/wwwlogs/access_nginx.log | awk '{print $1}' | sort | uniq -c | sort -rn | head -20
177 183.129.189.60
10 121.196.223.20
2 77.83.39.167
2 45.153.34.187
2 38.46.221.123
2 204.76.203.69
1 47.99.50.249
1 43.156.202.34
1 43.130.31.17
1 43.130.16.212
1 205.210.31.11
12. Add a rule to the security group of the Alibaba Cloud console: log in to the Alibaba Cloud console → ecs → security group → find the security group corresponding to my instance → add rules → select ‘adhere’ in the direction, select ‘reject’ in the policy, and fill in the source address 183.129.189.60, the port range is filled with -1/-1 (all ports). as shown in Figure 5

13. See who is still in a lot of requests now, 183.129.189.60 is still brushing! The security group rules may not take effect. Immediately block with iptables. as shown in Figure 6
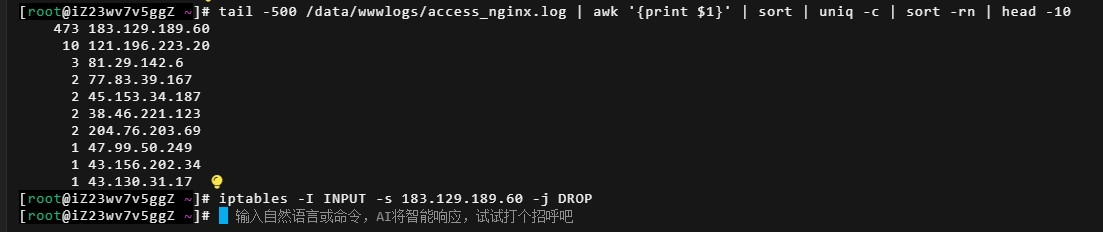
[root@iZ23wv7v5ggZ ~]# tail -500 /data/wwwlogs/access_nginx.log | awk '{print $1}' | sort | uniq -c | sort -rn | head -10
473 183.129.189.60
10 121.196.223.20
3 81.29.142.6
2 77.83.39.167
2 45.153.34.187
2 38.46.221.123
2 204.76.203.69
1 47.99.50.249
1 43.156.202.34
1 43.130.31.17
[root@iZ23wv7v5ggZ ~]#
14. Execute the following command and return 0, indicating that the ban was successful.
[root@iZ23wv7v5ggZ ~]# sleep 30 &amp;&amp; tail -100 /data/wwwlogs/access_nginx.log | grep "183.129.189.60" | wc -l
73
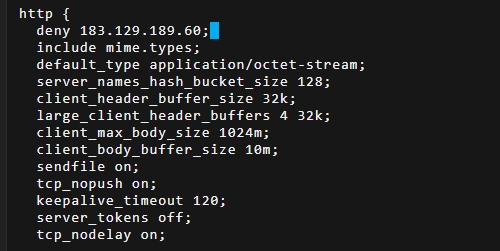
15. Since iptables does not work, it is sealed on the nginx level. It is directly blocked in the virtual host configuration corresponding to access_nginx.log. Find which virtual host it is. Then directly edit nginx.conf, after saving, restart nginx. as shown in Figure 7
[root@iZ23wv7v5ggZ ~]# grep -rl "access_nginx.log" /usr/local/nginx/conf/
/usr/local/nginx/conf/nginx.conf
[root@iZ23wv7v5ggZ ~]# vi /usr/local/nginx/conf/nginx.conf
[root@iZ23wv7v5ggZ ~]# service nginx restart
Redirecting to /bin/systemctl restart nginx.service
[root@iZ23wv7v5ggZ ~]#
16. Real-time monitoring, wait 30 seconds to see if there is any new one. If there is no output, the ban has taken effect. Confirm that it has taken effect. However, the load is still high and the blog is still responding 504
[root@iZ23wv7v5ggZ ~]# timeout 30 tail -f /data/wwwlogs/access_nginx.log | grep "183.129.189.60"
17. The load is stable at 7.6 and does not continue to decline. There are other things that are eating resources. Take a look at the current situation:
<h1>当前 PHP-FPM 进程状态</h1>
[root@iZ23wv7v5ggZ ~]# ps aux | grep "php-fpm" | grep -v grep | wc -l
6
<h1>实时看有没有那个 IP 的新请求</h1>
[root@iZ23wv7v5ggZ ~]# tail -20 /data/wwwlogs/access_nginx.log | awk '{print $4, $1}'
[25/Feb/2026:15:26:57 121.196.223.20
[25/Feb/2026:15:26:57 121.196.223.20
[25/Feb/2026:15:26:57 121.196.223.20
[25/Feb/2026:15:26:57 121.196.223.20
[25/Feb/2026:15:27:07 121.196.223.20
[25/Feb/2026:15:27:07 121.196.223.20
[25/Feb/2026:15:27:17 121.196.223.20
[25/Feb/2026:15:27:17 121.196.223.20
[25/Feb/2026:15:28:33 47.99.50.249
[25/Feb/2026:15:34:01 45.153.34.187
[25/Feb/2026:15:49:35 43.156.202.34
[25/Feb/2026:15:56:04 38.46.221.123
[25/Feb/2026:16:01:12 38.46.221.123
[25/Feb/2026:16:12:08 81.29.142.6
[25/Feb/2026:16:12:12 81.29.142.6
[25/Feb/2026:16:12:16 81.29.142.6
[25/Feb/2026:16:20:52 185.242.226.113
[25/Feb/2026:16:45:12 34.158.168.101
[25/Feb/2026:16:45:13 34.158.168.101
[25/Feb/2026:16:45:14 34.158.168.101
<h1>博客最近的请求</h1>
[root@iZ23wv7v5ggZ ~]# tail -20 /data/wwwlogs/www.shuijingwanwq.com_nginx.log | awk '{print $4, $1, $7}' | tail -10
[25/Feb/2026:16:56:34 143.20.219.229 /robots.txt
[25/Feb/2026:16:56:34 143.20.219.183 /tag/develop
[25/Feb/2026:16:56:34 222.167.251.252 /robots.txt
[25/Feb/2026:16:56:34 66.92.14.190 /robots.txt
[25/Feb/2026:16:56:34 222.167.251.15 /robots.txt
[25/Feb/2026:16:56:34 66.92.14.195 /robots.txt
[25/Feb/2026:16:56:34 136.0.94.155 /robots.txt
[25/Feb/2026:16:56:34 66.92.14.151 /robots.txt
[25/Feb/2026:16:56:35 143.20.219.77 /robots.txt
[25/Feb/2026:16:56:35 136.0.94.158 /robots.txt
<h1>我的服务器是几核的</h1>
[root@iZ23wv7v5ggZ ~]# nproc
1
[root@iZ23wv7v5ggZ ~]#
18. Find the root cause. Single-core CPU + a large number of distributed crawlers. My blog was requested by a dozen different IPs at the same second, these IPs Segments (143.20.219.x, 222.167.251.x, 66.92.14.x, 136.0.94.x) are distributed crawlers. A single-core machine can’t hold it at all. Block these crawler IP segments in batches in Nginx:
deny 183.129.189.60;
deny 143.20.219.0/24;
deny 222.167.251.0/24;
deny 66.92.14.0/24;
deny 136.0.94.0/24;
19. Finally, restart the ECS, and then observe the situation in the last few days. Whether 504 will still appear no. The problem has been solved. Summarize what I did:
PHP-FPM MAX_CHILDREN dropped from 16 to 5 (adapted to single-core 2GB)
Nginx blocks 5 malicious IP segments
Restart ECS to clear the backlog process
20. The accident is summarized as follows:
Direct reason
IP 183.129.189.60 launched a malicious security scan on the server, violent detection /core/static/ Sensitive files (settings.ini, secret.sql, database.json, etc.) under the path. Four distributed crawler IPs at the same time Segments (143.20.219.x, 222.167.251.x, 66.92.14.x, 136.0.94.x) request my blog in large numbers concurrently in the same second. These requests are all processed by PHP-FPM.
fundamental reason
My server is single-core CPU, 2GB memory, but php-fpm is configured with max_children = 16, start_servers = 10. Each PHP-FPM subprocess takes up about 110MB of memory, 16 processes = 1.76GB, and almost all 2GB of memory is consumed. This configuration has just supported normal traffic in the past 993 days, but has been in a ‘critical state’ and has no margin to deal with burst traffic.
avalanche process
Malicious scan + crawler traffic influx → 16 php-fpm processes are all full → memory is exhausted, the system starts to use swap → swap on disk, io slows → Each request processing time becomes longer → the process cannot be released in time → new request queued → nginx wait for the php-fpm response timeout → return 504 gateway timeout. The CPU load soared from 0.5 to 19.77, forming a vicious circle.
solution
PHP-FPM MAX_CHILDREN has been reduced from 16 to 5, adapting to a single-core 2GB hardware configuration. The Nginx level blocks malicious scan IP and four crawler IP segments, and the blocked requests directly return to 403, and no longer occupy the php-fpm process. Restart ECS clears the backlog of stuck process.
Lessons lessons
The number of processes in PHP-FPM must match the hardware resources of the server, and the single-core 2GB machine can run up to 5 processes. 993 days without restarting or adjusting the configuration, long-term resource critical state is the biggest hidden danger. The server should have basic protective measures, such as Nginx current limiting (LIMIT_REQ_ZONE) and malicious IP automatically ban, rather than running naked.