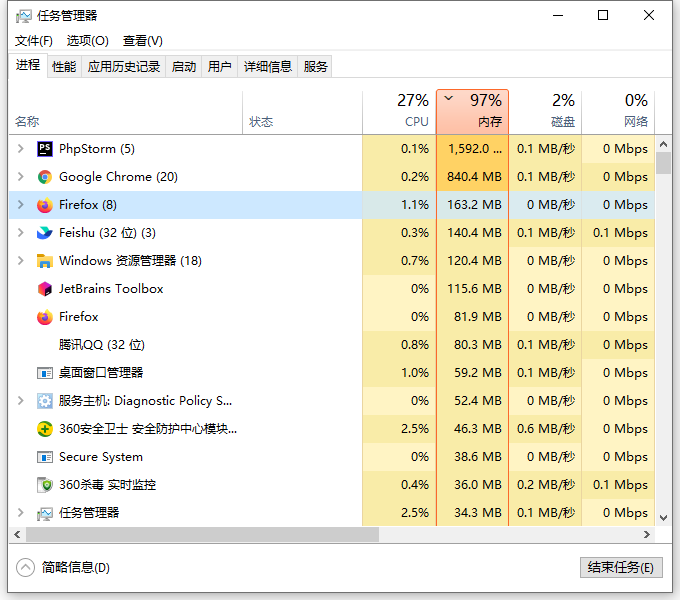
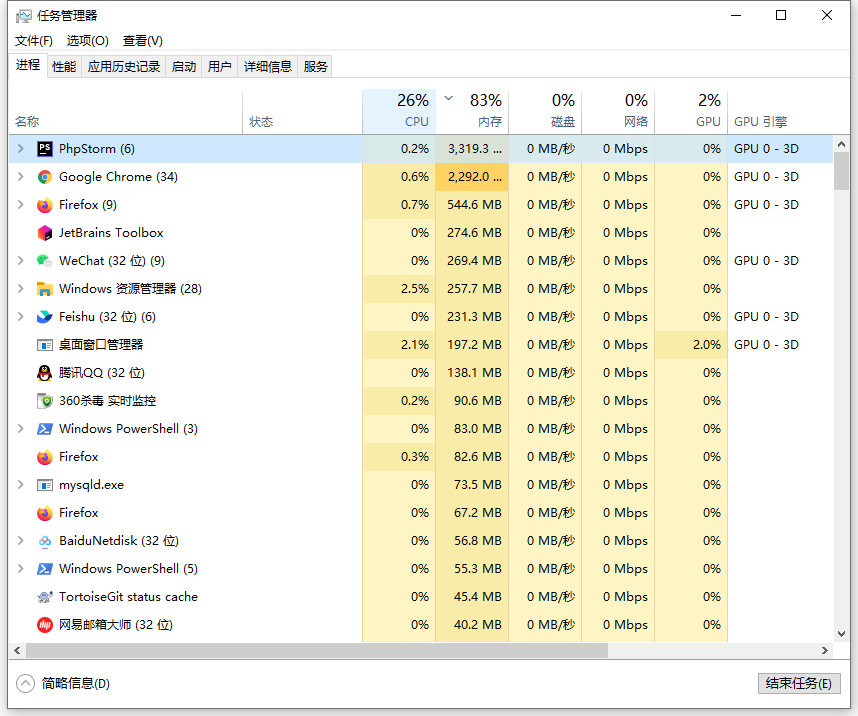
1. In Windows 10, the memory usage continues to exceed 95%. View Task Manager, occupies 98%. But the 2 processes that take up the largest memory add up to only 2GB. The total memory size is 16GB. Other processes do not occupy a lot of memory, and in theory, it is not so high that the occupancy ratio is so high. as shown in Figure 1
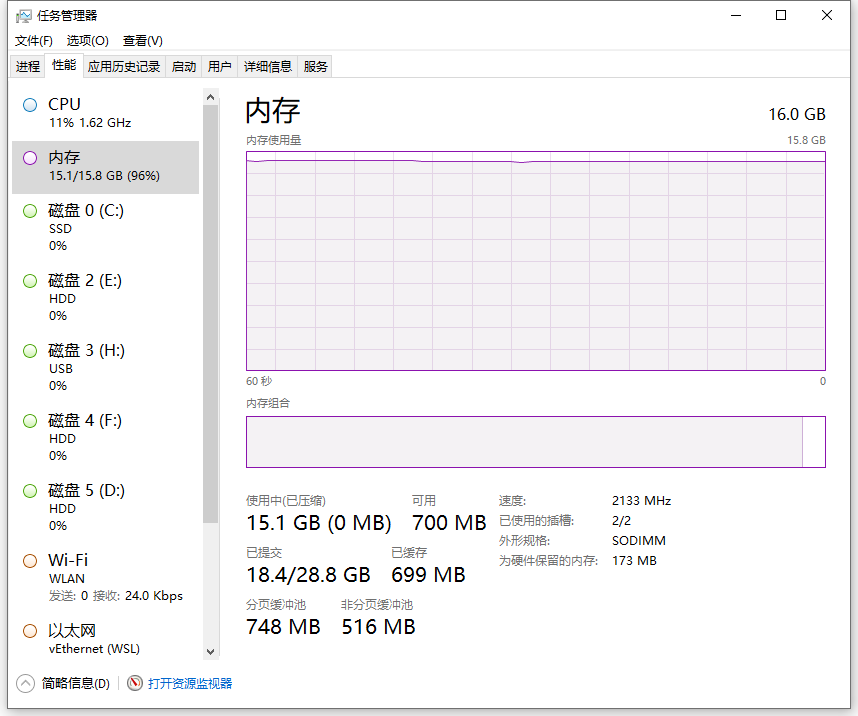
2. Check the performance – memory, in use (compressed): 15.5GB. Submitted: 25BG/32.7GB. as shown in Figure 2

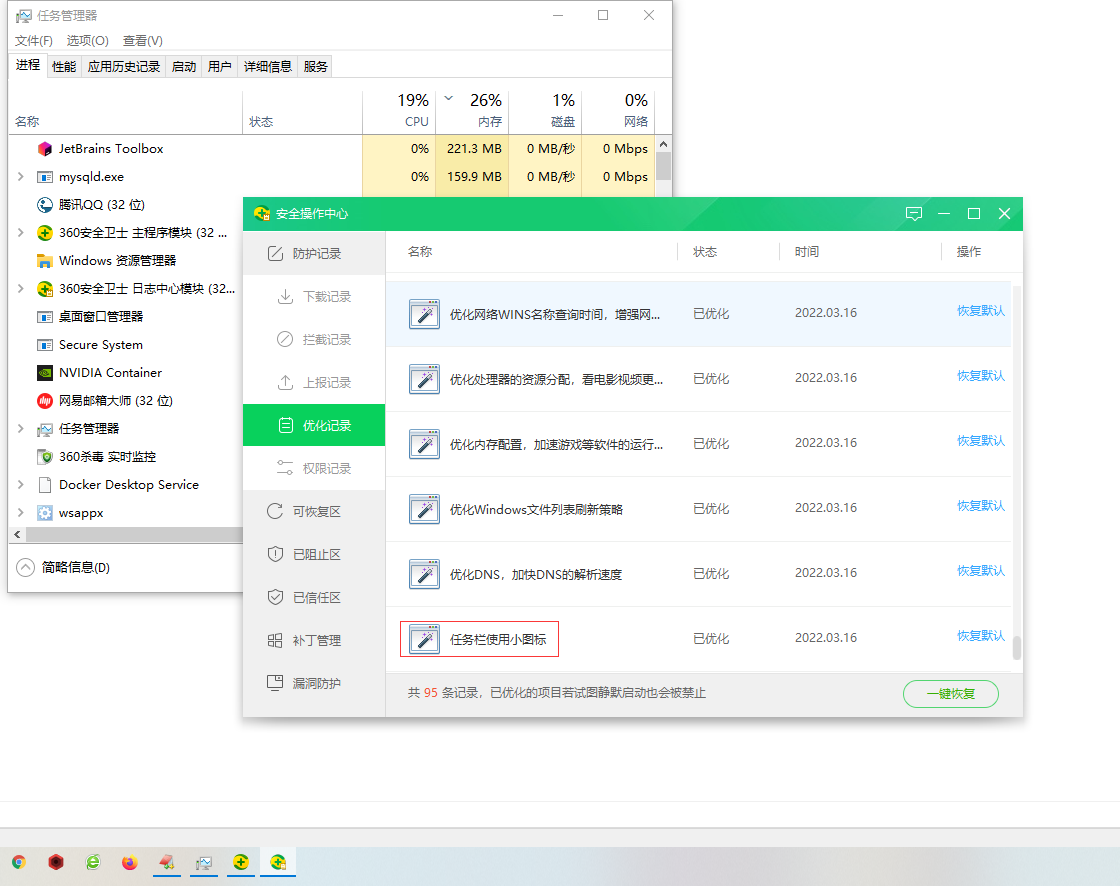
3. Open the 360 Security Guard – Optimize the acceleration interface, basically after all the items to be optimized are optimized. Still occupying more than 95%. as shown in Figure 3

4. After restarting the computer, it is found that the taskbar icon arrangement is not vertically centered. But the memory usage is still as high as 25%. Open the 360 Security Guard – Optimize the acceleration interface – Optimize the record – use the small icon on the taskbar – restore the default. as shown in Figure 4
5. It is generally accustomed to booting every Monday, and then continuing until Friday or Saturday. Generally speaking, on Thursday, the memory usage basically reaches about 95%. as shown in Figure 5
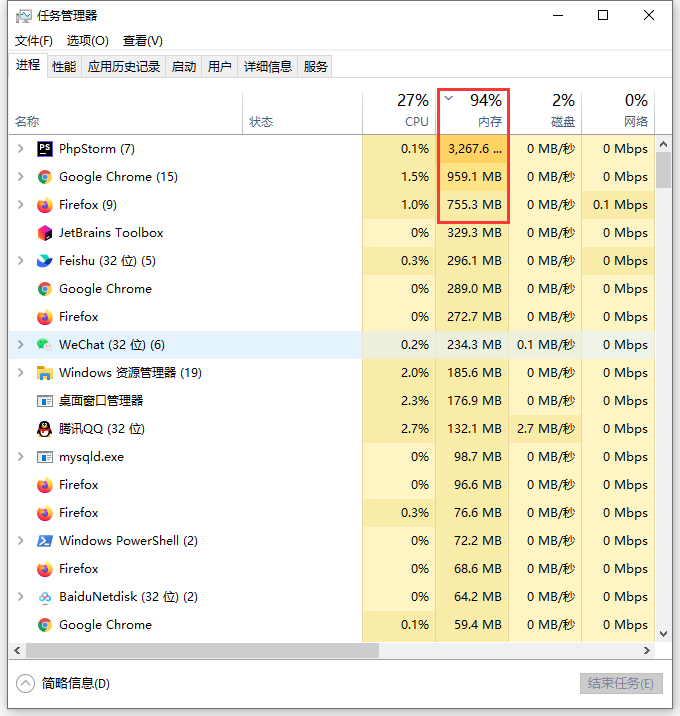
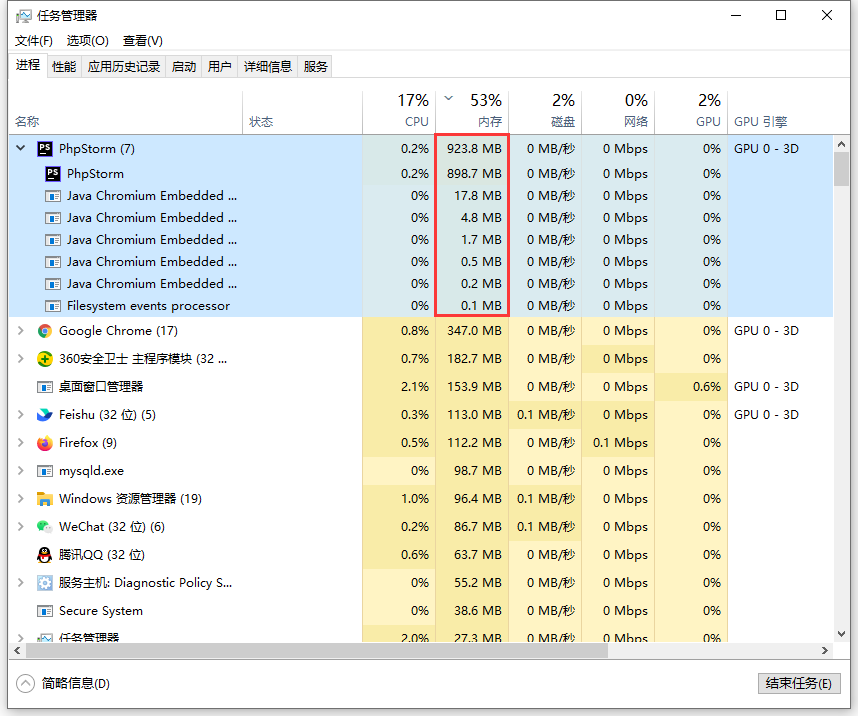
6. When using 360 Security Guard – My Computer – Immediate Checkup – After a single key repair, the memory usage is reduced to about 50%. Looking at the task manager, it is found that the memory usage of phpstorm is mainly reduced. Decreased from about 3200 MB to about 900 MB. as shown in Figure 6
7. However, based on the above interval less than half a day, the memory usage of PHPStorm has basically been restored to about 3GB. But it is not unacceptable that the IDE occupies 3GB. Mainly because there is still more than 10 GB of memory, it is impossible to determine how it is almost occupied.
8. Reference: https://answers.microsoft.com/en-us/windows/forum/all/windows-10 -UPGRADE-FROM-81-99-RAM-USAGE-AN/269BE2E2-DE0F-4E7A-B4FC-CC6DD40DA2CA , Network Diagnostic Usage (Windows Network Data Use Monitor) for short NDU. Press Win + R to open the run, then enter regedit, enter the registry editing page, and browse to the options below. Double-click on the Start item on the right, and set the value to 4 in the pop-up dialog box, and the default is 2. This setting disables some parts of the NDU. Restart the computer, and then observe whether the usage of the memory, CPU, hard disk, etc. has improved. as shown in Figure 7
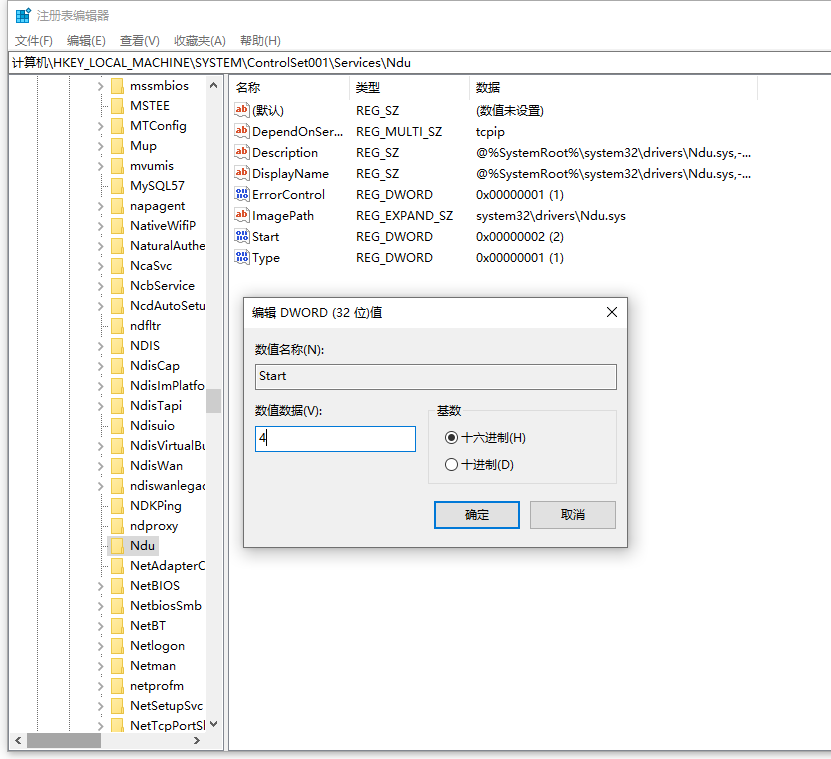
HKEY_LOCAL_MACHINE\System\ControlSet001\Services\NDU
9. Reference: https://answers.microsoft.com/zh-hans/windows/forum/all/win10%E5%86%8 5%E5%AD%98%E5%8D%A0%E7%94%A8%E8%B6%85 /23F4AC65-A125-4012-B541-D15F5F6E7051 . In step 2, the non-paging buffer pool: 1.2 GB. On Thursday, the non-paged buffer pool: 516 MB. as shown in Figure 8
10. Generally, the higher and higher the non-page buffer pool is caused by memory leaks in some software. It is recommended to uninstall some software that is not commonly used first. Then try to uninstall software that may cause memory leaks. Finally uninstalled the software: Heroku, after restarting the computer, the memory usage is reduced to about 70%. It means that Heroku basically takes up about 4GB of memory (25%). Reference: https://www.shuijingwanwq.com/2021/12/29/5622/
11. From Monday to Friday, it lasts for 5 days. Generally, it will be sleeping every night before leaving work. The current memory usage is still basically stable at around 85% on Friday. Compared with Figure 1, the memory occupied by PHPStorm and Google Chrome is relatively increased by about 3GB. as shown in Figure 9
Leave a Reply