Investigation and optimization record of a WordPress site 504 error
Background
my site www.shuijingwanwq.com It is a WordPress-based content station, with about 20,000 pages, and the average daily traffic is gradually increasing. The server uses Alibaba Cloud ECS (1 core 2GB), and the Web environment uses OneInStack (NGINX + PHP-FPM + Redis + Alibaba Cloud RDS MySQL). The website has been running smoothly until a large area suddenly appears one night 504 Gateway time-out, the background is especially slow and almost impossible to operate. In fact, I have encountered the same problem some time ago, and I have also made a preliminary optimization:My personal blog, today suddenly responded to 504’s troubleshooting process
problem
- The front-end pages cannot be opened intermittently, and there are occasional 504 errors in refresh;
- Backstage
/wp-admin/admin.phpLoading is very slow, often timeout; - Alibaba Cloud console display ECS CPU usage persists 100%;
- A large number of RDS error logs appear
Aborted connectionAndGot an error reading communication packets.
antecedent
1. Server basic status check
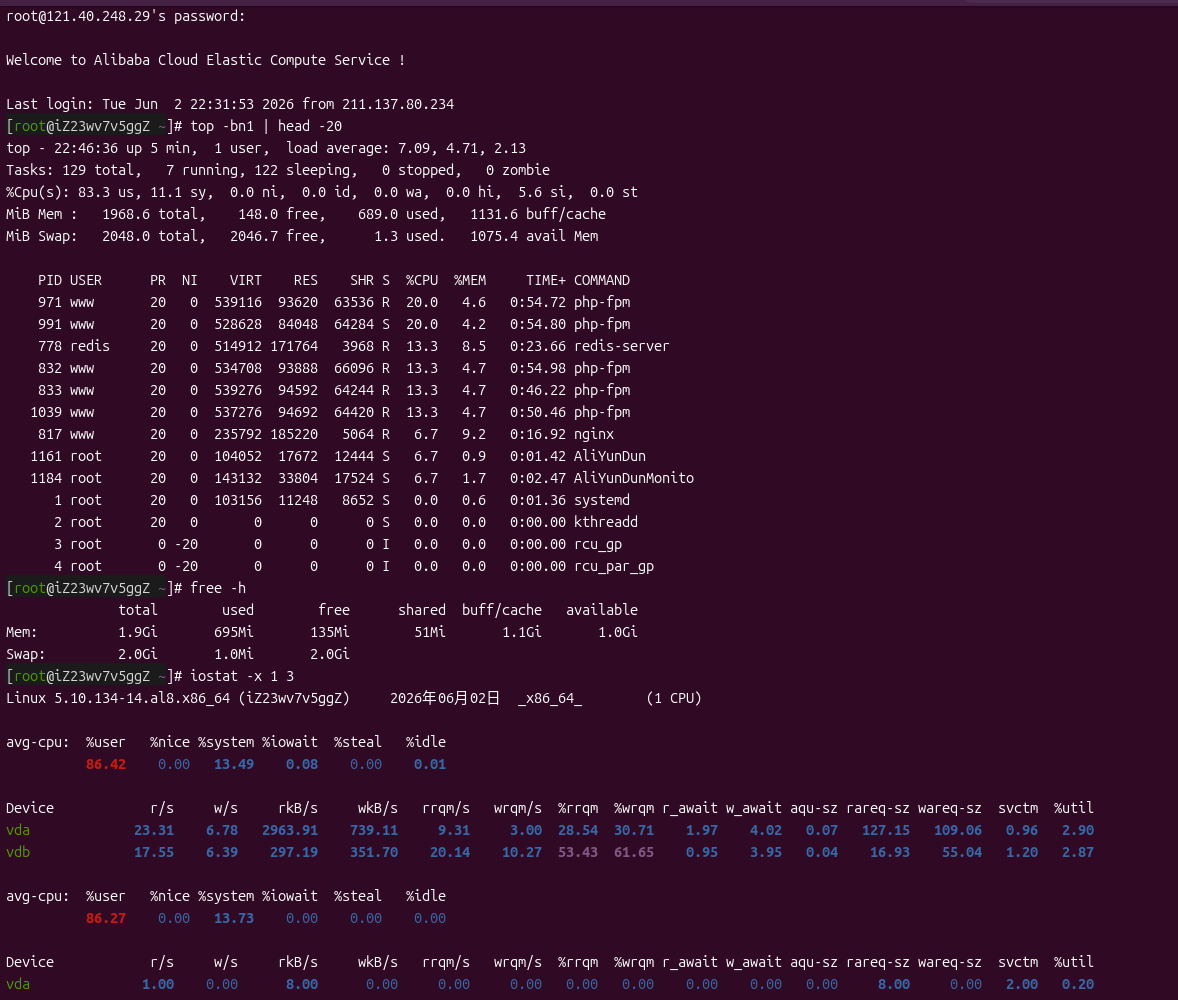
Log in to the server, execute top Loads up to 7.09 (1 core machine),%us more than 80%, multiple php-fpm The process occupies between 13% and 20% of the CPU,redis-server It also takes about 13% of the %id is 0. The remaining memory is about 150MB, and the swap is rarely used.Iostat show disk %util Very low, exclude disk I/O bottlenecks. as shown in Figure 1
2. PHP-FPM configuration analysis
Examine /usr/local/php/etc/php-fpm.conf, found several serious problems:
- Slow logs are repeatedly defined and finally overwritten to 0:
request_slowlog_timeoutAppeared twice, the first time3s, and then set to0, resulting in slow logs never take effect.
;;;;;;;;;;;;;;;;;;;;;
; FPM Configuration ;
;;;;;;;;;;;;;;;;;;;;;

;;;;;;;;;;;;;;;;;;
; Global Options ;
;;;;;;;;;;;;;;;;;;

[global]
pid = run/php-fpm.pid
error_log = log/php-fpm.log
log_level = warning

emergency_restart_threshold = 30
emergency_restart_interval = 60s
process_control_timeout = 5s
daemonize = yes

;;;;;;;;;;;;;;;;;;;;
; Pool Definitions ;
;;;;;;;;;;;;;;;;;;;;

[www]
listen = /dev/shm/php-cgi.sock
listen.backlog = -1
listen.allowed_clients = 127.0.0.1
listen.owner = www
listen.group = www
listen.mode = 0666
user = www
group = www

pm = ondemand
pm.max_children = 5
request_slowlog_timeout = 3s
slowlog = /usr/local/php/var/log/slow.log
pm.start_servers = 2
pm.min_spare_servers = 1
pm.max_spare_servers = 3
pm.max_requests = 500
pm.process_idle_timeout = 10s
request_terminate_timeout = 120
request_slowlog_timeout = 0

pm.status_path = /php-fpm_status
slowlog = var/log/slow.log
rlimit_files = 51200
rlimit_core = 0

catch_workers_output = yes
;env[HOSTNAME] = iZ23wv7v5ggZ
env[PATH] = /usr/local/bin:/usr/bin:/bin
env[TMP] = /tmp
env[TMPDIR] = /tmp
env[TEMP] = /tmp
- Timeout settings are not coordinated: php-fpm
request_terminate_timeout = 120s, and nginx is not setfastcgi_read_timeout(default 60s), which causes Nginx to return 504 first when PHP executes for more than 60 seconds, but PHP-FPM is still executing, waste of resources.
3. Nginx configuration is missing
Site profile /usr/local/nginx/conf/vhost/www.shuijingwanwq.com.conf The PHP processing part is missing in fastcgi_read_timeout, the default 60-second timeout.
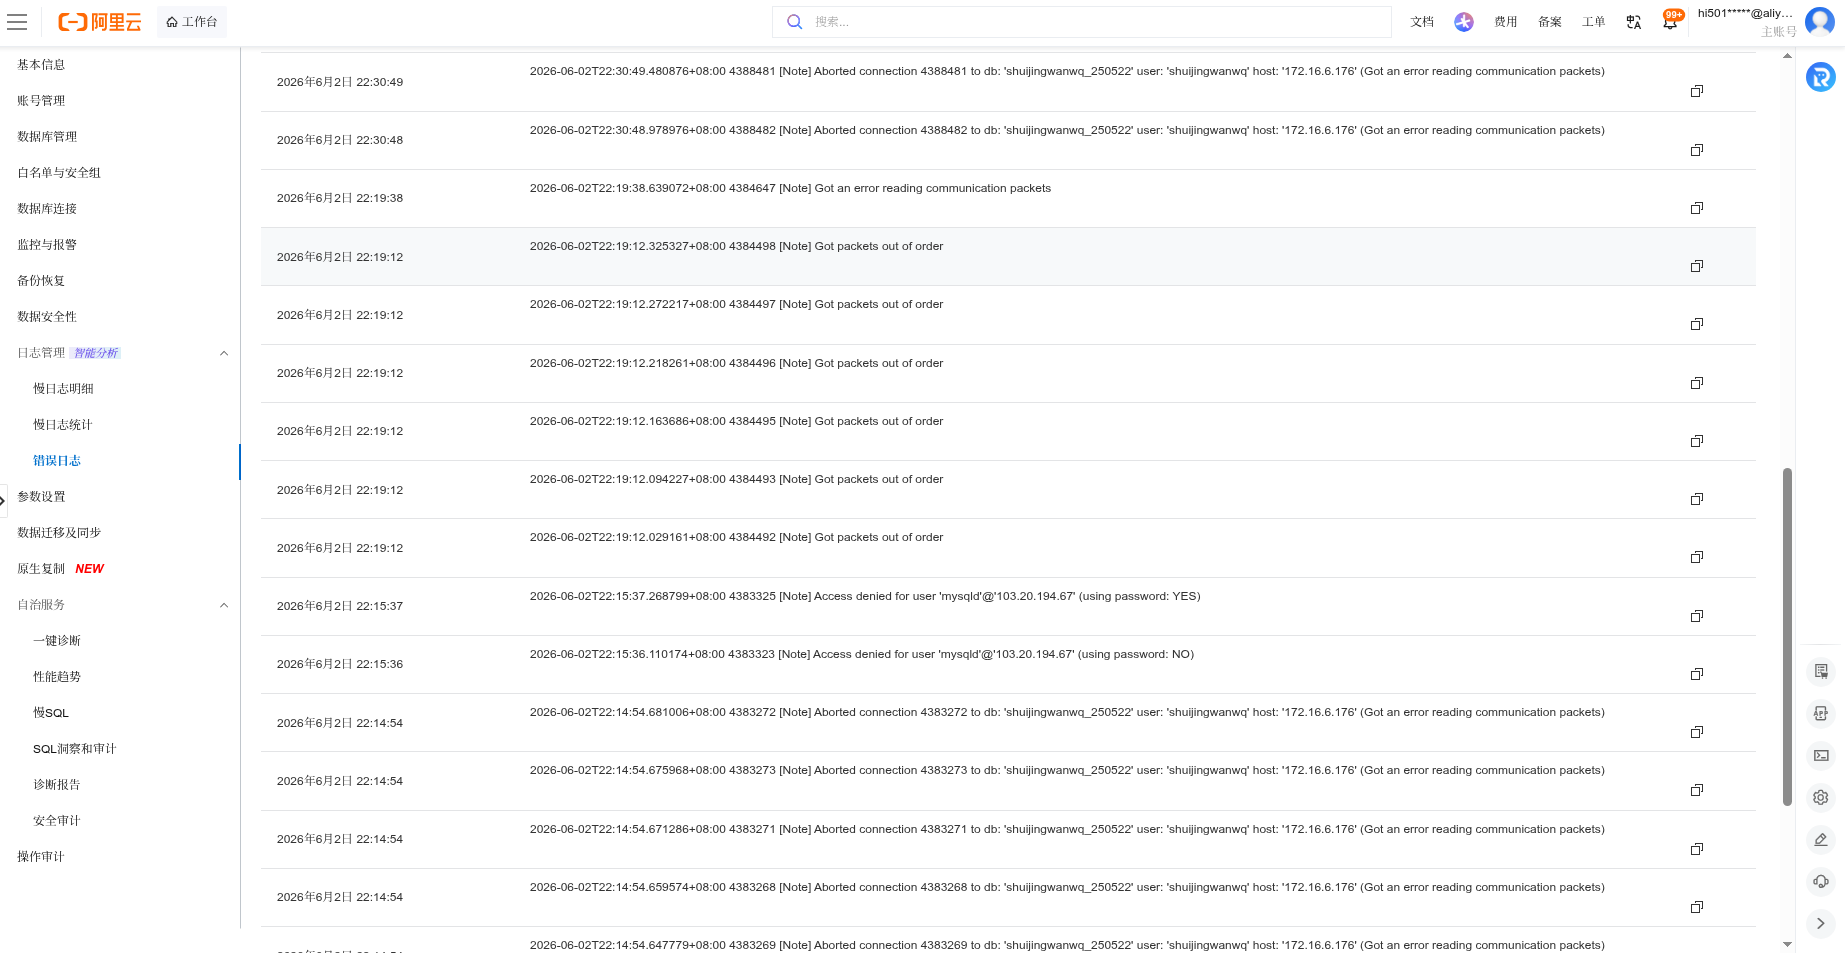
4. RDS error log analysis
The RDS console error logs appear a lot:
Aborted connection ... (Got an error reading communication packets)
Got packets out of order
This indicates that the connection between PHP and MySQL is abnormally interrupted, usually because PHP has been executed for too long, exceeding MySQL’s wait_timeout or the PHP process is terminated early. as shown in Figure 3
5. Slow log is empty
Whether it is php slow log (/usr/local/php/var/log/slow.log) or RDS slow query log (console slow log details), no data. The reason is that the PHP slow log is closed, RDS’s long_query_time By default 10 seconds, the current query may take 2 to 5 seconds but not recorded.
Solution
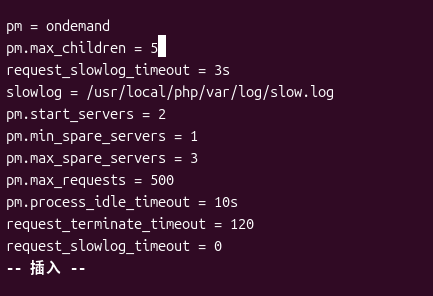
1. Fix PHP-FPM configuration
Use ondemand Mode, suitable for a 1-core small memory machine, and release the process when idle. The final configuration is as follows: as shown in Figure 4
;;;;;;;;;;;;;;;;;;;;;
; FPM Configuration ;
;;;;;;;;;;;;;;;;;;;;;

;;;;;;;;;;;;;;;;;;
; Global Options ;
;;;;;;;;;;;;;;;;;;

[global]
pid = run/php-fpm.pid
error_log = log/php-fpm.log
log_level = warning

emergency_restart_threshold = 30
emergency_restart_interval = 60s
process_control_timeout = 5s
daemonize = yes

;;;;;;;;;;;;;;;;;;;;
; Pool Definitions ;
;;;;;;;;;;;;;;;;;;;;

[www]
listen = /dev/shm/php-cgi.sock
listen.backlog = -1
listen.allowed_clients = 127.0.0.1
listen.owner = www
listen.group = www
listen.mode = 0666
user = www
group = www

pm = ondemand
pm.max_children = 5
pm.process_idle_timeout = 10s
pm.max_requests = 500

request_terminate_timeout = 120s
request_slowlog_timeout = 3s
slowlog = /usr/local/php/var/log/slow.log

catch_workers_output = yes
env[PATH] = /usr/local/bin:/usr/bin:/bin
env[TMP] = /tmp
env[TMPDIR] = /tmp
env[TEMP] = /tmp
- deleted with
ondemandconflictedpm.start_servers,pm.min/max_spare_servers. - Ensure that the slow log is unique and effective.
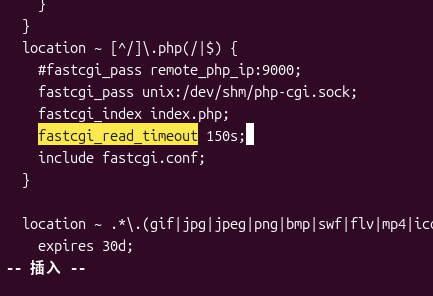
2. nginx increase timeout
Add in PHP processing location:
fastcgi_read_timeout 150s;
Make the Nginx timeout slightly greater than 120 seconds of PHP-FPM, avoiding the Nginx interruption in advance. as shown in Figure 5
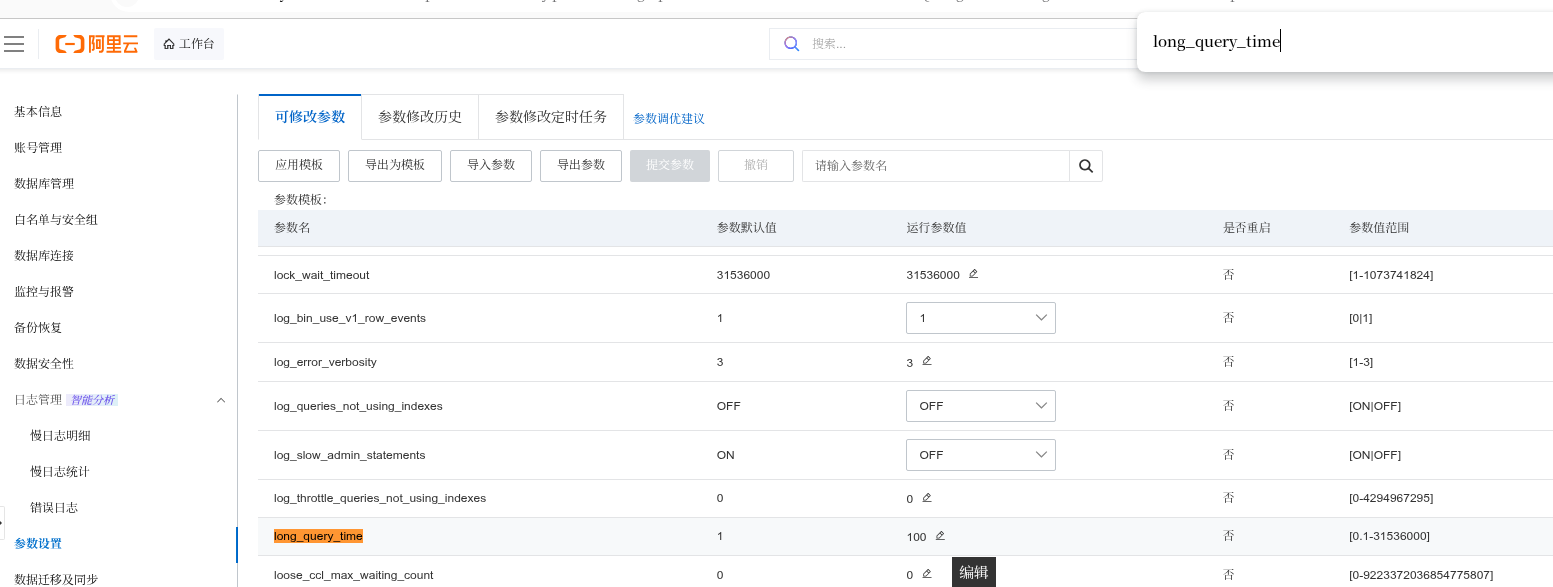
3. Adjust RDS Slow Query Threshold
Log in to the RDS console → parameter settings → set long_query_time Change from 100 to 1 second to capture more slow SQL. as shown in Figure 7
4. Restart the service
systemctl restart php-fpm
systemctl restart nginx
Result
After the adjustment, the website access back to normal, the CPU usage rate has dropped to the normal level, and the background response has been significantly improved. Connection interruptions in the RDS error log are greatly reduced. Although the RDS slow log still does not find particularly slow SQL, the overall bottleneck has been basically lifted.
Follow-up optimization suggestions
Although it has now been restored, the configuration of 1-core 2GB is still difficult, considering that the volume of data has reached 20,000 articles and the traffic has continued to grow. Here are the following optimization measures that can be taken in the future:
✅ 1. Hardware upgrade (fundamental)
- Upgrade ECS configuration: At least 2 cores and 4GB, 4 cores and 8GB are recommended. After upgrading, you can change the PHP-FPM mode to
dynamic,pm.max_childrenAdjusted to 10~15, the concurrent processing capacity has been greatly improved. - RDS Specifications Boost: If slow queries increase or the number of connections is often full, consider upgrading RDS memory or turning on read-only instances.
✅ 2. Speed up static resources with CDN
Alibaba Cloud CDN + OSS combination:
- Upload static files such as site pictures, CSS, JS to OSS, and enable CDN acceleration.
- Configure WordPress plugins such as Alioss to automatically sync media libraries.
- Effect: Reduce the pressure on ECS bandwidth and speed up the access speed of all parts of the country.
✅ 3. In-depth optimization of page cache
W3 Total Cache has been installed, it is recommended to check:
- page cache Use Disk Enhancement or Redis.
- Object Cache Confirm to use the Redis driver.
- database cache Also use Redis to avoid disk I/O.
- Turn on opcode cache(such as Zend Opcache).
✅ 4. Database special optimization
- periodicize
optimize tableOptimizationwp_posts,wp_postmetaWait for the big table. - Add indexes to common query fields, such as
post_date,meta_key. - Use index wp mysql for speed The plugin automatically analyzes and adds missing indexes.
✅ 5. Monitoring and Alarms
- Install Alibaba Cloud monitoring, and set a threshold alarm for the number of CPU, memory, and RDS connections.
- Write a daily scheduled script, check the PHP slow log and the RDS slow log, and send an email if a new slow request is found.
✅ 6. Regular cleaning and maintenance
- Clean out expired drafts, recycle bin articles, useless postmeta data.
- Disable or delete less commonly used plugins to reduce background add-ons.
- Configure WP-Cron to use the system crontab trigger instead to check the task queue every time you access.
Summary
The root cause of this 504 failure is Server configuration does not match business scale, plus the wrong setting of php-fpm parameter, resulting in CPU depletion and connection interruption. The problem is solved by correcting the configuration, increasing the timeout, and opening the slow log. In the long run, upgrading hardware and introducing CDN is the only way.
I hope this record can provide reference for friends who encounter similar problems. If you also have experience in WordPress high load optimization, welcome to exchange!
![json 字段中存储的是数组格式,值示例:[249, 247, 250, 244, 243, 255, 246, 245, 257, 248, 259, 252, 256]](https://www.shuijingwanwq.com/wp-content/uploads/2023/10/1-520x245.png)