Insert Mermaid flowchart using the Merpress plugin in WordPress
Introduction
In the process of remote job hunting, the screening of information sources and the control of the rhythm are very important. In order to show my job search strategy more intuitively, I decided to use the Mermaid flowchart to visualize the distribution and rhythm of information sources. In this way, you can not only help yourself to clarify your thinking, but also allow readers to understand my job search method more clearly.
Step 1: Install the Merpress plugin
First, you need to install the Merpress plugin in the WordPress background. In the plugin search page, enter ‘mermaid’ to find the plugin. Here is a screenshot of the plugin search page:
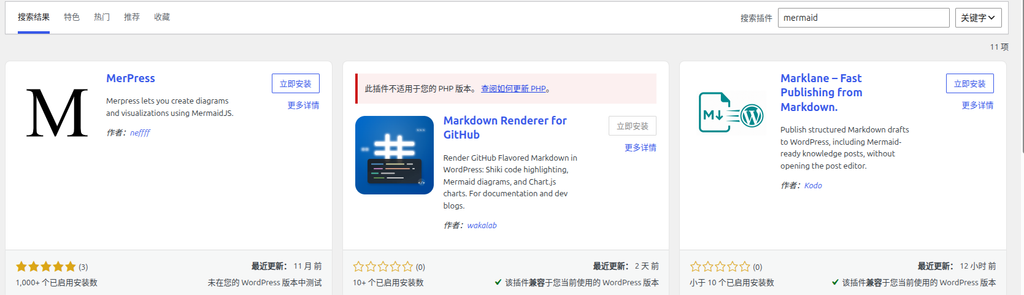
After clicking ‘Install Now’ and activating the plugin, you can use the Mermaid function in the article editor.
Step 2: Insert Mermaid code in the article
Next, insert the Mermaid code in the article editor, and when adding a block, search: Merpress. The following is a code example I use, describing the three rhythms of the remote job search source and the sources of information that are responsible for each:
flowchart LR
    A[远程求职信息源] --> B[每日·被动接收<br>TG 频道 5 个]
    A --> C[每周三·主动精筛<br>岗位网站 8 个]
    A --> D[每月一次·渠道发现<br>导航源 2 个]
    B --> B1[远程工作者]
    B --> B2[远程工作AI情报站]
    B --> B3[中高端IT技术招聘]
    B --> B4[海外远程/到岗技术招聘]
    B --> B5[DeJob Web3 招聘]
    C --> C1[Remote China 聚合]
    C --> C2[电鸭 / Larajobs / StudyGolang / Golangprojects]
    C --> C3[DeJob / Rebase Issues / ABetterWeb3]
    D --> D1[greathoul/remote-working<br>channels 目录]
    D --> D2[platform.work-work.org<br>Web3 平台导航]
Step 3: Preview the generated flowchart
After inserting the code, save and preview the article, you can see the generated flowchart. Here is a screenshot of the preview effect:
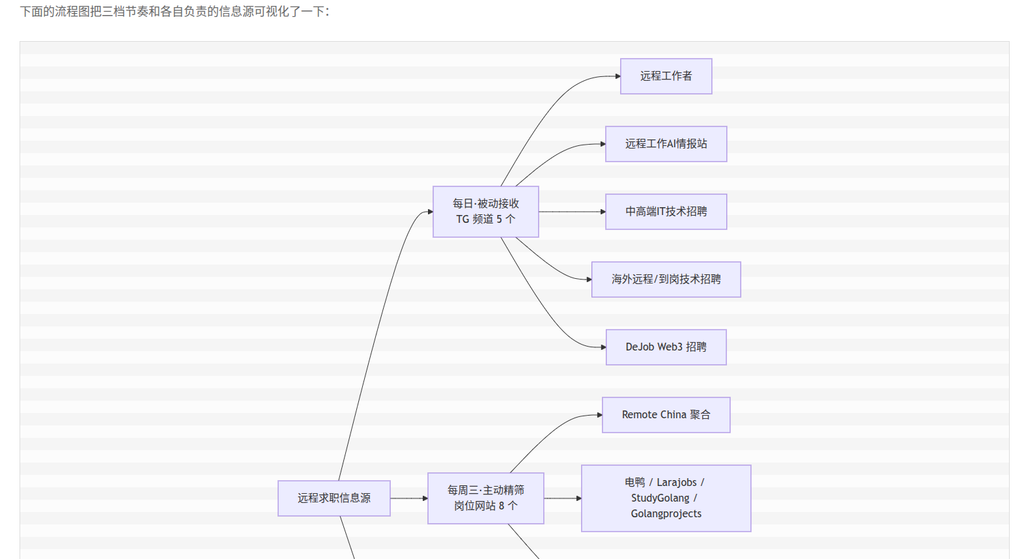
Description of the flowchart content
This flowchart shows my remote job search information source strategy, divided into three rhythms:
- Daily passive reception: Get information via 5 TG channels.
- Active sieve every Wednesday: Select suitable positions from 8 post websites.
- Channel discovery once a month: Discover new information channels through 2 navigation sources.
Each rhythm has a specific source of information, covering domestic remote, PHP/GO vertical, Web3 track and overseas direction.
Conclusion
Inserting the Mermaid flowchart with the MerMaid flowchart not only improves the readability of the article, but also makes the complex information source strategy clear at a glance. For technical blogs, visualization is an effective way to convey complex concepts, and it is recommended that you try to use them.