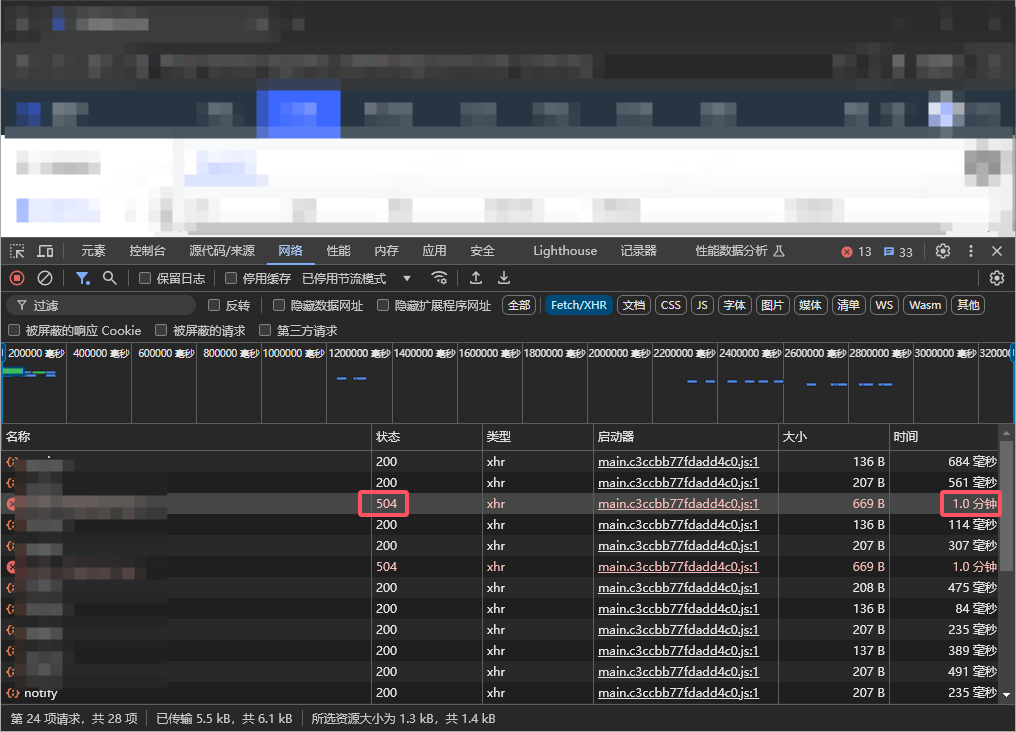
1. In the performance environment, the list interface response timeout. as shown in Figure 1
Figure 1
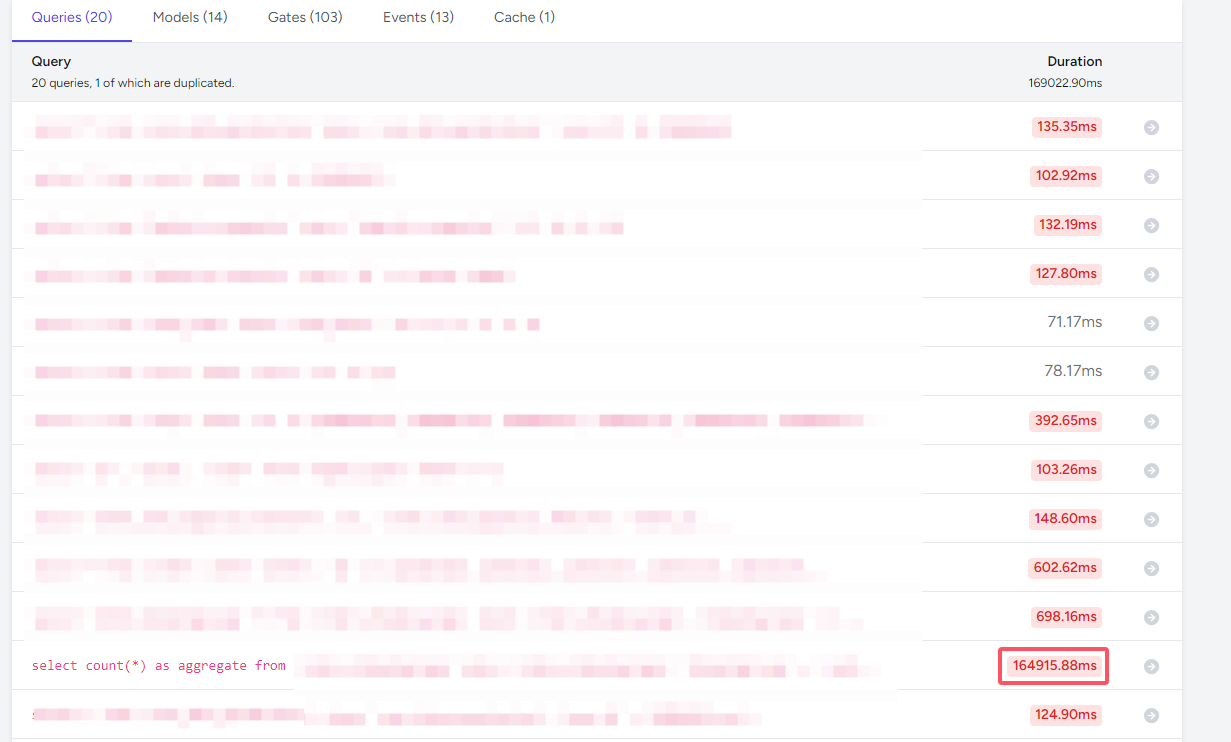
2. Determine the sql of the interface to execute, connect the mysql of the performance environment in the local environment, and then view the generated sql in Laravel Telescope, and find a select count(*) as aggregate FROM is much longer than other SQL, with a duration of 164915.88ms. as shown in Figure 2
Figure 2
select
  count(*) as aggregate
from
  `order_shipping_logs`
where
  `order_shipping_logs`.`shipping_type` = 1
  and `shipping_at_gmt` >= '2024-07-21 03:04:04'
  and `shipping_at_gmt` <= '2024-10-21 03:04:04'
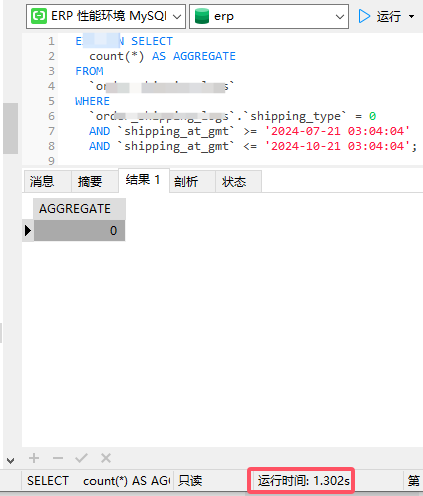
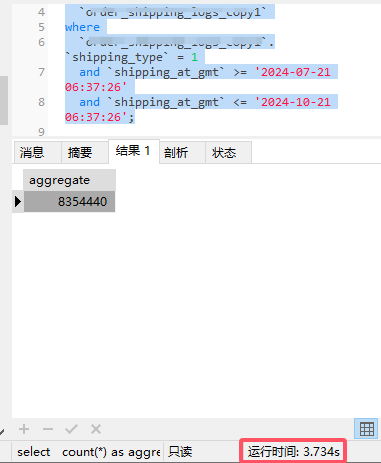
3. The value of the Shipping_Type column is 1, the total number is 8354440 (query time 174 seconds), and the value of the Shipping_Type column is 0 and the total number is 0. 1.3 seconds), that is, the base of the column is low (that is, the shipping_type value of most rows is the same), and the effect of indexing only the column may be limited. When the shipping_type is 1, the query needs to process a lot of data, and the performance is affected. as shown in Figure 3
Figure 3
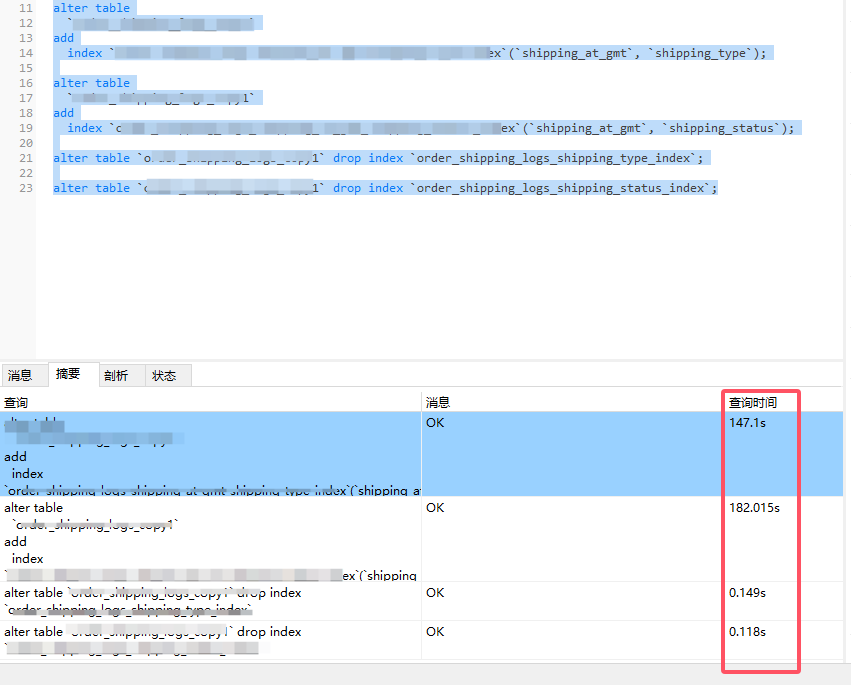
4. Decide to delete the single-column index, create a combined index, and index the two columns together. The order of the combined index is: shipping_at_gmt, shipping_type, so as to filter by time range, and then filter shipping_type. Shipping_Type has a low cardinality (i.e. there are many repeat values, only a few possible values, such as 0 and 1), while SHIPPING_AT_GMT It is a high base sequence (with many unique values, representing different time points), and the columns that preferentially index the high cardinality can improve the query performance. It took 330 seconds. as shown in Figure 4
Figure 4
alter table
  `order_shipping_logs`
add
  index `order_shipping_logs_shipping_at_gmt_shipping_type_index`(`shipping_at_gmt`, `shipping_type`);

alter table
  `order_shipping_logs`
add
  index `order_shipping_logs_shipping_at_gmt_shipping_status_index`(`shipping_at_gmt`, `shipping_status`);

alter table `order_shipping_logs` drop index `order_shipping_logs_shipping_type_index`;

alter table `order_shipping_logs` drop index `order_shipping_logs_shipping_status_index`;
5. Execute the SQL in step 2 again, which takes 4 seconds, in line with expectations. as shown in Figure 5
Figure 5
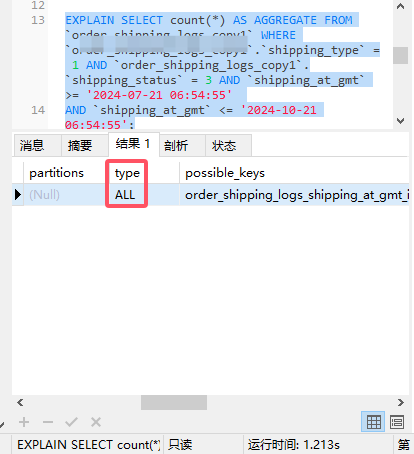
6. However, when the WHERE condition of SQL contains 3 fields at the same time, namely Shipping_AT_GMT, Shipping_Type, Shipping_Status , the query takes 95 seconds.
SELECT count(*) AS AGGREGATE FROM `order_shipping_logs_copy1` WHERE `order_shipping_logs_copy1`.`shipping_type` = 1 AND `order_shipping_logs_copy1`.`shipping_status` = 3 AND `shipping_at_gmt` >= '2024-07-21 06:54:55'
AND `shipping_at_gmt` <= '2024-10-21 06:54:55'
7. Decide to adjust the index structure of step 4. Decide to delete a single column index, create a combined index, and index the two columns together. The order of the combined index is: shipping_type, shipping_at_gmt. Avoid keeping two single column indexes individually. When the SQL WHERE condition contains 3 fields at the same time, namely SHIPING_AT_GMT, SHIPPING_TYPE, SHIPPING_STATUS , the query takes 95 seconds. Still a full table scan. as shown in Figure 6
Figure 6
alter table
  `order_shipping_logs`
add
  index `order_shipping_logs_shipping_type_shipping_at_gmt_index`(`shipping_type`, `shipping_at_gmt`);

alter table
  `order_shipping_logs`
add
  index `order_shipping_logs_shipping_status_shipping_at_gmt_index`(`shipping_status`, `shipping_at_gmt`);
8. Decide to keep the index structure of step 4. No more single-column indexes are deleted, combined indexes are created, and the two columns are indexed together. When the SQL WHERE condition contains 3 fields at the same time, namely Shipping_AT_GMT, SHIPPING_TYPE, SHIPPING_STATUS , the query takes 51 seconds. Still a full table scan.
9. Decide to keep the index structure of step 4. No more single-column indexes are deleted, combined indexes are created, and these three columns are indexed together. Execute the following SQL separately, and the execution time is basically about 5 seconds. in line with expectations. However, after adding the 4th field, the execution took more than 60 seconds.
alter table
`order_shipping_logs_copy2`
add
index `order_shipping_logs_shipping_at_gmt_status_type_index`(`shipping_at_gmt`, `shipping_status`, `shipping_type`);
# 耗时 3.4 秒
SELECT
count(*) AS AGGREGATE
FROM
`order_shipping_logs_copy2`
WHERE
`order_shipping_logs_copy2`.`shipping_type` = 1
AND `shipping_at_gmt` >= '2024-07-21 03:04:04'
AND `shipping_at_gmt` <= '2024-10-21 03:04:04';
# 耗时 3.4 秒
SELECT count(*) AS AGGREGATE FROM `order_shipping_logs_copy2`
WHERE
`order_shipping_logs_copy2`.`shipping_status` = 3
AND `shipping_at_gmt` >= '2024-07-21 03:04:04'
AND `shipping_at_gmt` <= '2024-10-21 03:04:04';
# 耗时 3.7 秒
SELECT count(*) AS AGGREGATE FROM `order_shipping_logs_copy2`
WHERE
`order_shipping_logs_copy2`.`shipping_type` = 1
AND `order_shipping_logs_copy2`.`shipping_status` = 3
AND `shipping_at_gmt` >= '2024-07-21 06:54:55'
AND `shipping_at_gmt` <= '2024-10-21 06:54:55';
# 耗时 123 秒
SELECT count(*) AS AGGREGATE FROM `order_shipping_logs_copy2`
WHERE
`order_shipping_logs_copy2`.`operated_source` in (2)
AND `order_shipping_logs_copy2`.`shipping_type` = 1
AND `order_shipping_logs_copy2`.`shipping_status` = 3
AND `shipping_at_gmt` >= '2024-07-21 06:54:55'
AND `shipping_at_gmt` <= '2024-10-21 06:54:55';
# 耗时 148 秒
SELECT count(*) AS AGGREGATE FROM `order_shipping_logs_copy2`
WHERE
`order_shipping_logs_copy2`.`operated_source` IN ( 2 )
AND `order_shipping_logs_copy2`.`shipping_type` = 1
AND `shipping_at_gmt` >= '2024-07-21 09:34:15'
AND `shipping_at_gmt` <= '2024-10-21 09:34:15'
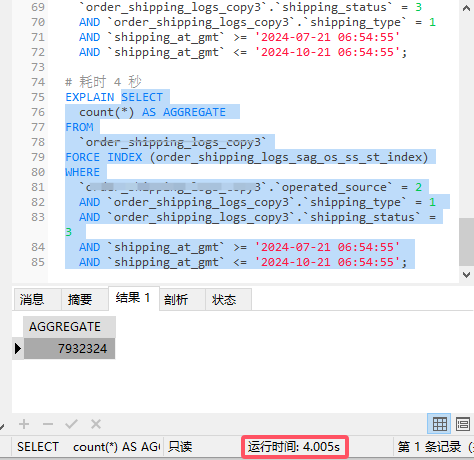
# 耗时 7.8 秒
SELECT count(*) AS AGGREGATE FROM `order_shipping_logs_copy2` WHERE `shipping_at_gmt` >= '2024-07-21 09:34:15'
AND `shipping_at_gmt` <= '2024-10-21 09:34:15';
10. It is finally decided to combine the 3 fields of the TinyInt type with the shipping_at_gmt , a total of 4 fields, and create a combined index. It is found that sometimes the combined index ORDER_SHIPPING_LOGS_SAG_OS_SS_ST_INDEX will not be used, and the execution may take more than 60 seconds.
ALTER TABLE `order_shipping_logs_copy3` ADD INDEX `order_shipping_logs_sag_os_ss_st_index` ( `shipping_at_gmt`, `operated_source`, `shipping_status`, `shipping_type` );

# 耗时 4.2 秒
SELECT count(*) AS AGGREGATE FROM `order_shipping_logs_copy3`
WHERE
	`shipping_at_gmt` >= '2024-07-21 09:34:15'
	AND `shipping_at_gmt` <= '2024-10-21 09:34:15';

# 耗时 5.8 秒
EXPLAIN SELECT
	count(*) AS AGGREGATE
FROM
	`order_shipping_logs_copy3`
WHERE
	`order_shipping_logs_copy3`.`operated_source` IN ( 1, 2 )
	AND `shipping_at_gmt` >= '2024-07-21 03:04:04'
	AND `shipping_at_gmt` <= '2024-10-21 03:04:04';

# 耗时 90 秒
EXPLAIN SELECT count(*) AS AGGREGATE FROM `order_shipping_logs_copy3`
WHERE
	`order_shipping_logs_copy3`.`shipping_status` = 3
	AND `shipping_at_gmt` >= '2024-07-21 03:04:04'
	AND `shipping_at_gmt` <= '2024-10-21 03:04:04';

# 耗时 119 秒
SELECT
	count(*) AS AGGREGATE
FROM
	`order_shipping_logs_copy3`
WHERE
	`order_shipping_logs_copy3`.`shipping_type` = 1
	AND `shipping_at_gmt` >= '2024-07-21 03:04:04'
	AND `shipping_at_gmt` <= '2024-10-21 03:04:04';

# 耗时 36.4 秒
SELECT count(*) AS AGGREGATE FROM `order_shipping_logs_copy3`
WHERE
	`order_shipping_logs_copy3`.`operated_source` IN ( 1, 2 )
	AND `order_shipping_logs_copy3`.`shipping_status` = 3
	AND `shipping_at_gmt` >= '2024-07-21 06:54:55'
	AND `shipping_at_gmt` <= '2024-10-21 06:54:55';

# 耗时 42 秒
SELECT count(*) AS AGGREGATE FROM `order_shipping_logs_copy3`
WHERE
	`order_shipping_logs_copy3`.`operated_source` IN ( 1, 2 )
	AND `order_shipping_logs_copy3`.`shipping_type` = 1
	AND `shipping_at_gmt` >= '2024-07-21 06:54:55'
	AND `shipping_at_gmt` <= '2024-10-21 06:54:55';

# 耗时 178 秒
SELECT count(*) AS AGGREGATE FROM `order_shipping_logs_copy3`
WHERE
	`order_shipping_logs_copy3`.`shipping_status` = 3
	AND `order_shipping_logs_copy3`.`shipping_type` = 1
	AND `shipping_at_gmt` >= '2024-07-21 06:54:55'
	AND `shipping_at_gmt` <= '2024-10-21 06:54:55';

# 耗时 162 秒
EXPLAIN SELECT
	count(*) AS AGGREGATE
FROM
	`order_shipping_logs_copy3`
WHERE
	`order_shipping_logs_copy3`.`operated_source` = 2
	AND `order_shipping_logs_copy3`.`shipping_type` = 1
	AND `order_shipping_logs_copy3`.`shipping_status` = 3
	AND `shipping_at_gmt` >= '2024-07-21 06:54:55'
	AND `shipping_at_gmt` <= '2024-10-21 06:54:55';
11. Finally, it is decided to force the use of the combined index ORDER_SHIPPING_LOGS_SAG_OS_SS_ST_INDEX when the condition contains Shipping_AT_GMT and the other 3 fields, and the time-consuming control is 5 seconds or so. The final index structure is as follows. as shown in Figure 7
Figure 7
# 耗时 4.2 秒
EXPLAIN SELECT count(*) AS AGGREGATE FROM `order_shipping_logs_copy3`
WHERE
	`shipping_at_gmt` >= '2024-07-21 09:34:15'
	AND `shipping_at_gmt` <= '2024-10-21 09:34:15';

# 耗时 3.6 秒
EXPLAIN SELECT
	count(*) AS AGGREGATE
FROM
	`order_shipping_logs_copy3`
FORCE INDEX (order_shipping_logs_sag_os_ss_st_index)
WHERE
	`order_shipping_logs_copy3`.`operated_source` IN ( 1, 2 )
	AND `shipping_at_gmt` >= '2024-07-21 03:04:04'
	AND `shipping_at_gmt` <= '2024-10-21 03:04:04';

# 耗时 3.4 秒
EXPLAIN SELECT
	count(*) AS AGGREGATE
FROM `order_shipping_logs_copy3`
FORCE INDEX (order_shipping_logs_sag_os_ss_st_index)
WHERE
	`order_shipping_logs_copy3`.`shipping_status` = 3
	AND `shipping_at_gmt` >= '2024-07-21 03:04:04'
	AND `shipping_at_gmt` <= '2024-10-21 03:04:04';

# 耗时 3.4 秒
SELECT
	count(*) AS AGGREGATE
FROM
	`order_shipping_logs_copy3`
FORCE INDEX (order_shipping_logs_sag_os_ss_st_index)
WHERE
	`order_shipping_logs_copy3`.`shipping_type` = 1
	AND `shipping_at_gmt` >= '2024-07-21 03:04:04'
	AND `shipping_at_gmt` <= '2024-10-21 03:04:04';

# 耗时 3.7 秒
SELECT
	count(*) AS AGGREGATE
FROM `order_shipping_logs_copy3`
FORCE INDEX (order_shipping_logs_sag_os_ss_st_index)
WHERE
	`order_shipping_logs_copy3`.`operated_source` IN ( 1, 2 )
	AND `order_shipping_logs_copy3`.`shipping_status` = 3
	AND `shipping_at_gmt` >= '2024-07-21 06:54:55'
	AND `shipping_at_gmt` <= '2024-10-21 06:54:55';

# 耗时 3.9 秒
SELECT
	count(*) AS AGGREGATE
FROM `order_shipping_logs_copy3`
FORCE INDEX (order_shipping_logs_sag_os_ss_st_index)
WHERE
	`order_shipping_logs_copy3`.`operated_source` IN ( 1, 2 )
	AND `order_shipping_logs_copy3`.`shipping_type` = 1
	AND `shipping_at_gmt` >= '2024-07-21 06:54:55'
	AND `shipping_at_gmt` <= '2024-10-21 06:54:55';

# 耗时 3.7 秒
SELECT
	count(*) AS AGGREGATE
FROM `order_shipping_logs_copy3`
FORCE INDEX (order_shipping_logs_sag_os_ss_st_index)
WHERE
	`order_shipping_logs_copy3`.`shipping_status` = 3
	AND `order_shipping_logs_copy3`.`shipping_type` = 1
	AND `shipping_at_gmt` >= '2024-07-21 06:54:55'
	AND `shipping_at_gmt` <= '2024-10-21 06:54:55';

# 耗时 4 秒
EXPLAIN SELECT
	count(*) AS AGGREGATE
FROM
	`order_shipping_logs_copy3`
FORCE INDEX (order_shipping_logs_sag_os_ss_st_index)
WHERE
	`order_shipping_logs_copy3`.`operated_source` = 2
	AND `order_shipping_logs_copy3`.`shipping_type` = 1
	AND `order_shipping_logs_copy3`.`shipping_status` = 3
	AND `shipping_at_gmt` >= '2024-07-21 06:54:55'
	AND `shipping_at_gmt` <= '2024-10-21 06:54:55';
12. However, when executing the following SQL, when the combined index is not used, it takes 1.4 seconds. It takes 2.1 seconds to use the combined index. On the contrary, the time-consuming has increased. That is, if you force the combination index ORDER_SHIPING_LOGS_SAG_OS_SS_ST_INDEX if you include SHIPPING_AT_GMT and 3 other fields, you can make sure that SQL Execution will not take more than 60 seconds, but at some point the execution time increases. At present, it is acceptable.
CREATE TABLE `order_shipping_logs` (
  `id` bigint unsigned NOT NULL AUTO_INCREMENT,
  `shipping_status` tinyint unsigned NOT NULL DEFAULT '2' COMMENT '交运状态,2:交运中;3:交运成功;4:交运失败;5:取消成功;6:取消失败',
  `shipping_at_gmt` datetime DEFAULT NULL COMMENT '交运时间',
  `shipping_type` tinyint unsigned NOT NULL DEFAULT '1' COMMENT '交运类型,1:订单交运;2:取消交运',
  `operated_source` tinyint unsigned NOT NULL DEFAULT '2' COMMENT '操作来源,1:规则交运;2:手动交运;3:打回待处理;4:修改/删除物流渠道;5:修改/删除货运单号;6:重新交运;7:订单拆分;8:订单合并',
  PRIMARY KEY (`id`) USING BTREE,
  KEY `order_shipping_logs_shipping_at_gmt_index` (`shipping_at_gmt`) USING BTREE,
  KEY `order_shipping_logs_operated_source_index` (`operated_source`) USING BTREE,
  KEY `order_shipping_logs_shipping_type_index` (`shipping_type`),
  KEY `order_shipping_logs_shipping_status_index` (`shipping_status`),
  KEY `order_shipping_logs_sag_os_ss_st_index` (`shipping_at_gmt`,`operated_source`,`shipping_status`,`shipping_type`)
) ENGINE=InnoDB AUTO_INCREMENT=16787 DEFAULT CHARSET=utf8mb4 COLLATE=utf8mb4_unicode_ci COMMENT='订单交运日志表';

# 耗时 1.3 秒
SELECT
	count(*) AS AGGREGATE
FROM
	`order_shipping_logs_copy3`
WHERE
	`order_shipping_logs_copy3`.`shop_plat_id` IN ( 1 )
	AND `order_shipping_logs_copy3`.`shop_id` IN ( 6 )
	AND `order_shipping_logs_copy3`.`operator_user_id` IN ( 9549 )
	AND `order_shipping_logs_copy3`.`logistic_company_id` IN ( 153 )
	AND `order_shipping_logs_copy3`.`operated_source` IN ( 2 )
	AND `order_shipping_logs_copy3`.`shipping_type` = 2
	AND `order_shipping_logs_copy3`.`shipping_status` = 3
	AND `shipping_at_gmt` >= '2024-07-22 02:01:14'
	AND `shipping_at_gmt` <= '2024-10-22 02:01:14';

# 耗时 2.1 秒
SELECT
	count(*) AS AGGREGATE
FROM
	`order_shipping_logs_copy3`
FORCE INDEX (order_shipping_logs_sag_os_ss_st_index)
WHERE
	`order_shipping_logs_copy3`.`shop_plat_id` IN ( 1 )
	AND `order_shipping_logs_copy3`.`shop_id` IN ( 6 )
	AND `order_shipping_logs_copy3`.`operator_user_id` IN ( 9549 )
	AND `order_shipping_logs_copy3`.`logistic_company_id` IN ( 153 )
	AND `order_shipping_logs_copy3`.`operated_source` IN ( 2 )
	AND `order_shipping_logs_copy3`.`shipping_type` = 2
	AND `order_shipping_logs_copy3`.`shipping_status` = 3
	AND `shipping_at_gmt` >= '2024-07-22 02:01:14'
	AND `shipping_at_gmt` <= '2024-10-22 02:01:14';
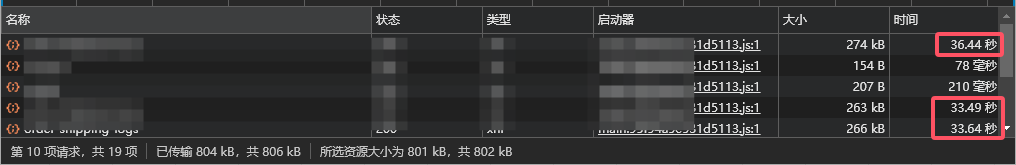
13. In the performance environment, the response time of the list interface is about 30 seconds, which is not as expected. Expected to be within 10 seconds. as shown in Figure 8
8
14. Determine the SQL for the interface to execute, connect the MySQL performance environment in the local environment, and the response time of the list interface is about 10 seconds. Then look at the generated SQL in Laravel Telescope and find a SELECT `ORDER_SHIPPING_LOGS`.* FROM ORDER_SHIPPING_LOGS FORCE INDEX It takes much longer than other SQL, with a duration of 30679.38ms. Then select count(*) as aggregate from requires the use of the combinatorial index, and the select `order_shipping_logs`.* from does not need to force the combination index. as shown in Figure 9
Figure 9
15. Reference: Force Laravel 9 to use the combined index in the paging count() query, and at the same time make the actual data query not use the forced index. Due to time constraints, the implementation is suspended.
16. Reference: When the fields in WHERE contain SHIPPING_AT_GMT and SHIPPING_STATUS|SHIPPING_TYPE|OPERATED_SOURCE when the combined index is forced to be used, otherwise the combined index is not mandatory
One response to “Optimization of list interface response timeouts (flexible control based on SQL to control whether MySQL combined index is mandatory)”

Leave a Reply