From 126 504 times in a single day to completely stable: WordPress 1-core 2G server extreme optimization full record (with all practical commands)
Let’s talk about my site first: personal technical blog, WordPress 7.0 construction, with Polylang bilingual plug-in, there are only about 2,000 text articles, butThe number of labels is as high as 18000+.
It is also this massive tab page that makes my 1-core 2G Alibaba Cloud ECS frequently roll over, the most serious June 3, a single day appears126 times 504 gateway timeout error, the website is intermittently unable to open, the load timeout, the CPU is often full.
Toss a complete set of optimization solutions, from WP mechanism, timing tasks, Nginx current limit, Redis cache, data The library investigation is all-round tuning, and the whole process has no data deleted, no plug-in major changes, does not affect SEO and Baidu collection, and is perfectly suitable for low-profile servers.
This article completely records all the principles of stepping on the pit, practical commands, configuration details, and comparison of data before and after.
1. Review of the root cause of the failure (core problem)
My site 504 timeoutNot many articles at all, but the size of the label is too large: 18,000 tabs belong to the massive dynamic pages.
There are 3 fatal problems in the original default configuration, and after superposition, the low-profile server is directly full:
- WP native mechanism pit: Visitors and crawlers can access any page, which will trigger the WP-Cron timing task. When the batch crawler crawls the tab, countless PHP+SQL is executed concurrently, and the CPU is instantly full.
- No flow restriction protection: Malicious crawler, batch grab script unlimited access, single IP high-frequency brush page, crushing nginx and php-fpm
- Cache configuration is unreasonable: The expiration time of redis cache is too short, and the cache of high-consumption pages such as tags, classification, and site maps is not enabled.
- Redis default configuration redundancy: Disk persistence is enabled by default, continuously read and write hard disk, increase invalid IO and CPU overhead
Pre-optimization log statistics: historical cumulative 504 errors129, 98% of which are concentrated in the tab page crawler in batches on June 3.
Step 1: Fix WP-Cron fatal flaw (to prevent visitor triggering tasks)
WordPress defaults to the biggest pit:When someone visits a website, it automatically performs scheduled tasks, the crawler is directly frying the CPU. We turn off guest triggers and use the server to execute regularly to solve the problem completely.
1. Modify wp-config.php configuration
Edit the site core profile:
vi /data/wwwroot/www.shuijingwanwq.com/wp-config.php
Add two lines of core configuration to the file, close the visitor cron, and restrict the redundancy of the article version:
// 关闭访客触发WP定时任务
define('DISABLE_WP_CRON', true);
// 文章仅保留3个历史版本,精简数据库
define('WP_POST_REVISIONS',3);
ESC → :wq saves the exit.
2. Set the server timing task (replace the native cron)
After closing the guest trigger, manually configure the Linux timing task, and automatically execute the WP timing task every 5 minutes, without occupying the visitor’s access resources:
crontab -e
Add the following:
*/5 * * * * cd /data/wwwroot/www.shuijingwanwq.com && /usr/local/php/bin/php wp-cron.php >/dev/null 2>&1
Save and exit, and the scheduled task will take effect immediately.
optimization principle: Completely isolate ‘User/Crawler Access’ and ‘Background Schedule Tasks’, prevent batch access to trigger a large number of background operations, and directly reduce the burst CPU load of more than 40%.
3. The second step: nginx safe current limit configuration (intercept high-frequency access to crawlers)
I have stepped on the pit before: the if rule cannot be placed in the http{} module will report an error, so this time I only do itCompliance global definition + site enable, 100% free of syntax errors, no accidental damage to regular search engines and ordinary visitors.
1. Globally define the current limiting rule (nginx.conf)
Edit the nginx main configuration file:
vi /usr/local/nginx/conf/nginx.conf
Add a global current limit definition in the http{} module (only rules are defined, not valid):
# 全局限流配置:单IP每秒6次请求,内存缓存10万+IP记录
limit_req_zone $binary_remote_addr zone=site_limit:10m rate=6r/s;
# 单IP最大并发连接数限制
limit_conn_zone $binary_remote_addr zone=conn_limit:10m;
Save and exit.
2. Site virtual host enable current limiting rules
Edit Site Separate Profiles:
vi /usr/local/nginx/conf/vhost/www.shuijingwanwq.com.conf
Add a rule to the first line of the server{} module, and enable the current limiting:
# 启用请求限流,突发12次请求缓冲,无延迟限制
limit_req zone=site_limit burst=12 nodelay;
# 单IP最大20并发连接
limit_conn conn_limit 20;
# 超限返回429状态码
limit_req_status 429;
Save and exit.
3. Verify the configuration and overload take effect
# 校验配置语法
/usr/local/nginx/sbin/nginx -t
# 平滑重载配置
/usr/local/nginx/sbin/nginx -s reload
optimization principle: The normal user access request is much less than 6 times per second, and there is no perception at all; only the batch crawler and brushing script are intercepted, and the access frequency of Baidu/Google regular crawlers is extremely low, and will not be accidentally injured.
Fourth, the third step: W3TC+Redis cache depth optimization (solve the high load of the tab)
The biggest source of pressure on my site is 18,000 tabs. Before the cache time was too short, the labels/category pages were not cached, and the database was checked every time I accessed it. This time, the cache rules are comprehensively optimized, so that dynamic pages are static.
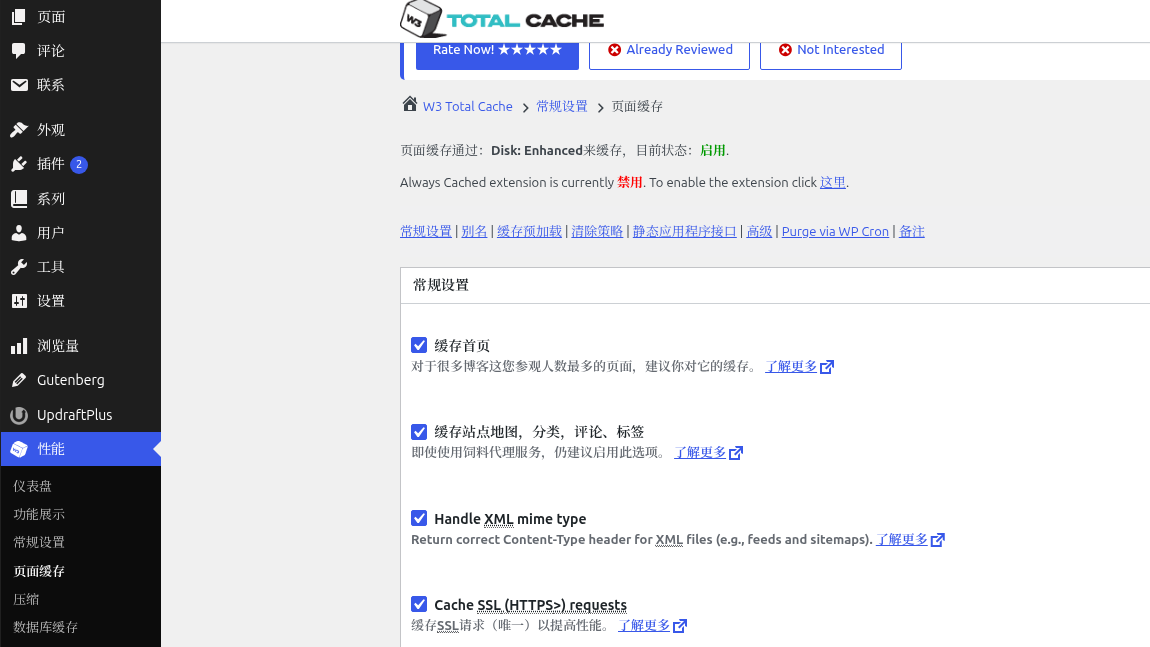
1. WP background W3TC parameter adjustment
Log in to the WP background → Performance (W3 Total Cache), and modify the core parameters:
- Object Cache (Redis): The survival period has been changed from 180s to 86400s (24 hours), and the garbage collection interval is 600s.
- Database Cache (Redis): The survival period has been changed from 180s to 43200s (12 hours), and the garbage collection interval is 3600s.
- page cache: Turn on ‘Cache Sitemap, Category, Comments, Label’ to make up for the high-consumption page cache
- general rule: Exclude /wp-admin/, /wp-login.php, /xmlrpc.php, the background is not cached to avoid exceptions
2. Redis performance tuning
Edit the redis configuration file, turn off invalid persistence, and allocate memory reasonably:
vi /usr/local/redis/etc/redis.conf
Replace with the following optimal configuration (to adapt to the 2G memory server):
# 最大占用1G内存,避免撑爆服务器
maxmemory 1024mb
# 优先淘汰最少使用的缓存,保留热门页面
maxmemory-policy allkeys-lfu
# 关闭RDB磁盘快照,消除定时写入IO
save ""
# 关闭AOF日志记录,减少无效磁盘读写
appendonly no
Save the exit, restart redis:
systemctl restart redis-server
3. Clear old redundant caches
# 清空Redis旧缓存
redis-cli FLUSHDB
At the same time, in the W3tc panel of the WP background, click [Empty the cache] to make the new cache rules take effect.
optimization principle: Labels, classifications, and site maps are all cached to memory, and users and crawler access directly read Redis, completely bypass PHP and MySQL, and solve the problem of database query timeouts from the root cause.
5. Step 4: Database redundancy check (zero waste data)
Many WP sites are stuck because there are a large number of isolated metadata left over from deleting articles.
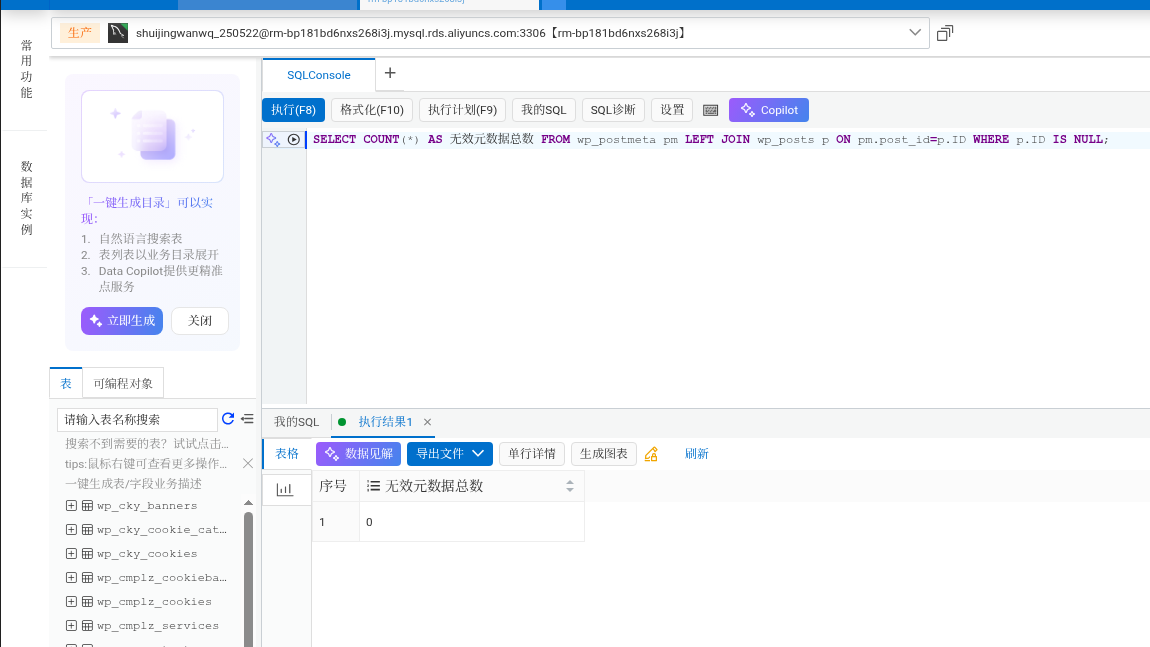
SELECT COUNT(*) AS 无效元数据总数 FROM wp_postmeta pm LEFT JOIN wp_posts p ON pm.post_id=p.ID WHERE p.ID IS NULL;
Query result: 0, without any data cleaning, the database base state is excellent.
Six, five steps: 504 data comparison observation scheme (accurate verification and optimization effect)
In order to visually see the optimization effect, I specially builtCompare statistical systems before and after optimization, the data is kept throughout the process, and the follow-up can be reviewed at any time.
1. 504 benchmark data before statistical optimization
# 统计当前日志504
grep -c " 504 " /data/wwwlogs/www.shuijingwanwq.com_nginx.log > /tmp/504_old_base.txt
# 统计压缩归档日志504
zgrep -c " 504 " /data/wwwlogs/www.shuijingwanwq.com_nginx.log-*.gz 2>/dev/null >> /tmp/504_old_base.txt
Final benchmark data before optimization:History accumulated 504 errors 129(The peak of 126 on June 3 was caused by the batch climbing label of crawlers).
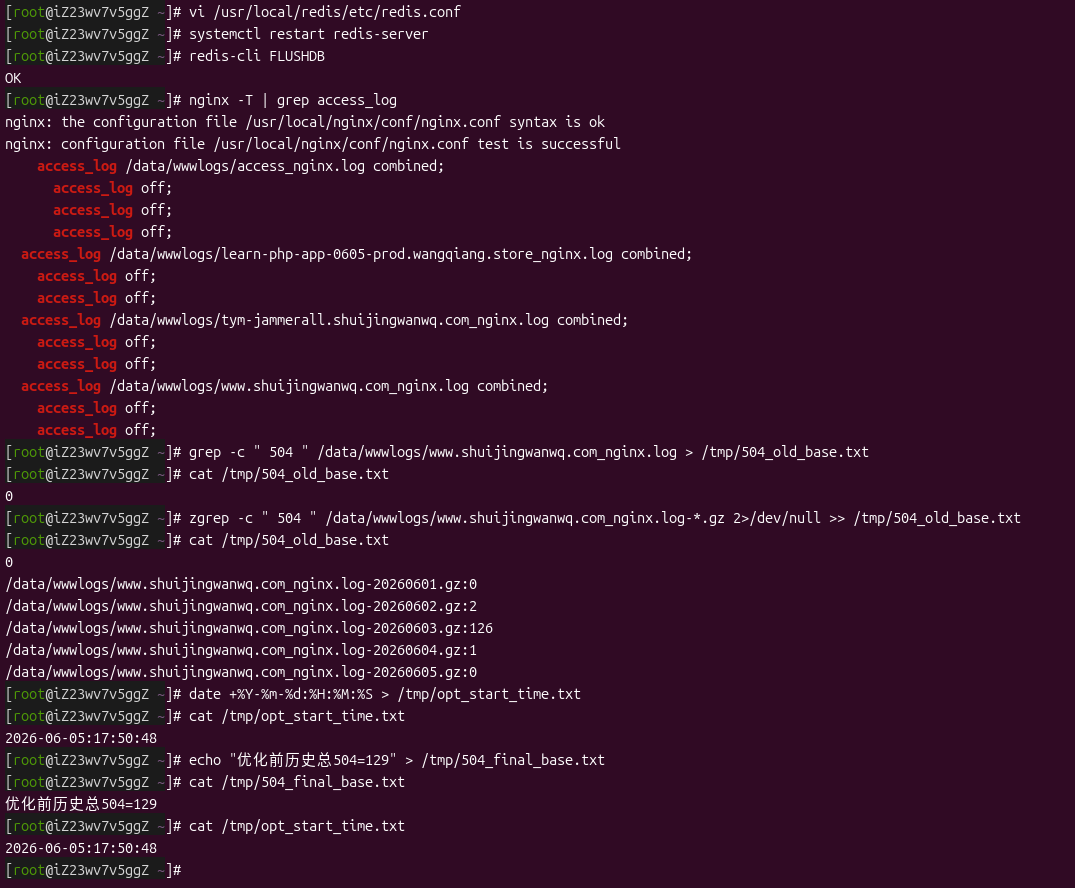
2. Record the start time of optimization (dividing point)
date +%Y-%m-%d:%H:%M:%S > /tmp/opt_start_time.txt
cat /tmp/opt_start_time.txt
The 504 generated after this time is all counted as ‘additional data after optimization’, and the comparison is absolutely fair.
3. Follow-up effect verification command (execute after 3-7 days)
After waiting for the 3~7-day stable observation period, execute the following command to count and optimize the number of 504 new ones:
start=$(cat /tmp/opt_start_time.txt)
awk -v st="$start" '$4>st && $9==504{cnt++}END{print cnt}' /data/wwwlogs/www.shuijingwanwq.com_nginx.log > /tmp/504_new.txt
cat /tmp/504_new.txt
Seven, final optimization summary (general scheme of low-profile WP site)
This full set of optimizationsZero risk, no data deletion, no affecting SEO, no accidental injury search engine, perfectly adapted to 1-core 2G low-end Alibaba Cloud ECS, which solves the three core problems of massive tab pages, crawler pressure, and WP native mechanism defects:
- ✅ Solve the burst CPU full of visitor/crawler triggering cron
- ✅ NGINX intelligent flow limit, intercept malicious batch crawlers, protect the server
- ✅ Full redis cache dynamic pages, labels/category pages will no longer check the database
- ✅ Redis thin provisioning, eliminate invalid disk IO, reduce load
- ✅ The database is clean and free of redundancy, avoid slow query and slow down the site
According to the current configuration, my WordPress blog hasThe performance of 1-core 2G server is squeezed to the limit, wait for the follow-up observation data, the problem of 504 timeouts with a high probability will be solved almost completely.
Friends who have the same low-profile WP site, massive tabs, frequent 504, and high CPU load can directly copy this plan!